UCA Economist, Dr. Jeremy Horpedahl, Receives Award for COVID-19 Work

(Conway, AR) – Dr. Jeremy Horpedahl, Associate Professor of Economics at the University of Central Arkansas (UCA) College of Business, has been recognized for his work to provide accurate coronavirus information and dispel misinformation during the COVID-19 pandemic. The award comes from the Mercatus Center at George Mason University, which announced on Sunday its ten most recent winners across North America.

Dr. Horpedahl won the prize for his policy and data analysis on pandemic-related economic topics such as coronavirus precautions, tolls and trends, vaccination development and distribution, unemployment, as well as local, national, and worldwide financial impacts.

“Part of what motivated me was simply to understand the pandemic better myself, and I was glad to help others navigate the same questions that I had about the state of the world,” said Dr. Horpedahl.

Horpedahl was also a co-recipient of another award from the Mercatus Center for the blog EconomistWritingEveryDay.com, where he is a weekly contributor.

“Dr. Horpedahl’s efforts to communicate complex topics in a more approachable way has helped inform and educate others about economic policy. This is important work during an already confusing and stressful time, and we are proud of his effort and impact,” added Dr. Michael Hargis, Dean of the UCA College of Business. [Read more…]

The Restaurant Recession

Jeremy Horpedahl, Ph.D., assistant professor of economics

One of the most visible signs of the COVID-19 recession has been the massive harm to restaurants and bars. We see it as we drive around town: Restaurants are closed, doing curbside service only, or have radically altered their layout to make their spaces safer.

We can also see the harm to restaurants in the economic data. Back in the depths of the shutdowns and labor market contraction in April, fully one-third of all job losses in Texas were centered on the “food services and drinking places” industry, as the Bureau of Labor Statistics calls these establishments. Pre-pandemic, this industry accounted for 8.7 percent of all nonfarm jobs in Texas.

In total, over 450,000 restaurant and bar workers were out of work, out of about 1.1 million before the pandemic. Relative to the size of the restaurant and bar industry, workers at these businesses were hit four times as hard as the average worker. While everything is bigger in Texas, these figures are closely comparable to national data, where restaurants and bars accounted for 7.9 percent of employment before the pandemic, and about 28 percent of job losses through April.

Within the restaurant and bar industry, bars and restaurants that depend primarily on dining room service were hit much harder. Fast food restaurants, for example, were already well-equipped to provide drive-thru service.

Read more at Texas CEO Magazine.

What’s the Real Unemployment Rate?

By Jeremy Horpedahl, Ph.D.

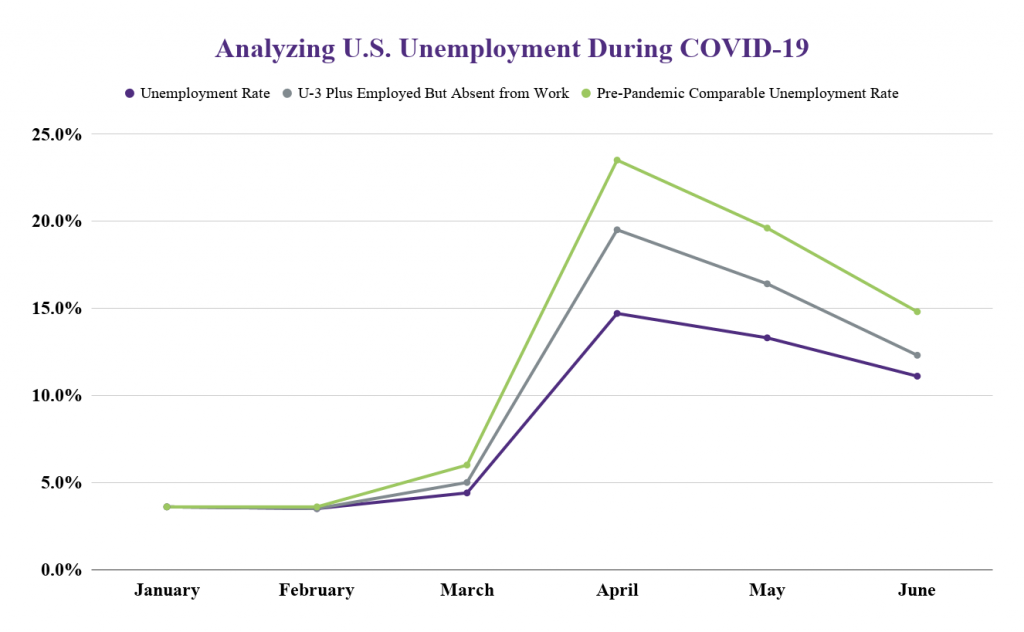
The latest data on the U.S. labor market was released on July 2 and saw the unemployment rate drop to 11.1% and nearly 5 million jobs were added in June. The unemployment rate aims to give a broad picture of how the labor market is performing. June’s rate is lower than 14.7% and 13.3% in April and May, respectively, but is still well above January and February when it was under 4%.

The unemployment rate has limitations in normal times, and during the current health and economic crisis it has even more limitations. To account for these limitations, it is useful to look at two broader measures of the number of people out of work. This allows us to see the percent of people out of work is higher than the official unemployment rate, but the trends are broadly the same: April was the worst month for the labor market, and there has been significant improvement in May and June.

What’s Wrong with the Unemployment Rate?

Jeremy Horpedahl, Ph.D.

There are two major problems with the official unemployment rate. First, is a current issue with the survey itself, which is administered by the Census Bureau. Survey takers were instructed to classify workers as unemployed (on temporary layoff) if they were not at their job due to COVID-19, but some survey takers classified these people as employed (but absent from work). BLS is aware of the problem and working to more accurately and consistently classify unemployed people correctly.

Thankfully, BLS also provides us with the data so we can reclassify these workers ourselves. That’s what the second, middle line does in the accompanying chart. Classifying all of those workers who aren’t at their job because of COVID-19, we see that these alternate unemployment rates are slightly higher: 12.3% vs. 11.1%. But the trend is the same as the official unemployment rate, and the classification problems are getting smaller over time (only about 1 million misclassified workers in June, compared with 7.5 million in April).

There is another, potentially bigger reason the unemployment rate undercounts the severity of the economic crisis: People who have dropped out of the labor force are not counted in the unemployment rate. If a worker has lost their job — not just on temporary layoff — and they are not currently looking for a new job, they don’t exist for purposes of calculating the official unemployment rate. And there are a lot of people in this situation: currently over 4.6 million people (though down from 8.1 million people in April).

As with the misclassified workers, BLS provides enough data that we can add these workers back in and count them as unemployed. Putting both of these groups of people into the unemployed category gives us the third highest line on the chart. This method was suggested by Michael D. Farren at the Mercatus Center, and he calls it the Pre-Pandemic Comparable Unemployment Rate. I have updated the data using his method in the accompanying chart. As we can see in the chart, this rate is higher still: 14.8% in June. But that’s a big improvement over April and May.

We don’t have similar data at the state level, so we can’t make similar adjustments to Arkansas’s unemployment rate. We do know that in May 2020, Arkansas’s unemployment rate of 9.5% was lower than the national average of 13.3%, and lower than Arkansas’s number from April, which was 10.8%.

What’s Next for the Labor Market?

Looking at the past few months of unemployment data is important for understanding how bad the pandemic has been for the U.S. labor market. But it doesn’t tell us what we really want to know: What happens next?

There is no guarantee that the unemployment rate and other alternate rates will continue to fall just because they have for two months. And I have no crystal ball to tell you what will happen next. The unemployment rate data is always a bit behind what we would like: the most recently released data was for the second week of June, and we won’t see data for the July reference week (which is July 12-18) until Aug. 7.

There are two possible scenarios for the next month in the US labor market. The first is that states continue to lift restrictions on business and personal activity, and that Americans become less concerned about the effects of COVID-19 on their own health and the health of others. People will then spend more money in the economy in general, but also more money specifically in industries that have been hit the hardest, such as leisure and hospitality. More workers will come back to their jobs, businesses will resume hiring, and the unemployment rate will continue to fall.

There is also a pessimistic scenario. The reopening of state economies appears to have led to an increase in positive COVID-19 cases in almost every state, and in a few states — such as Arkansas, Texas, and Arizona — these new cases have turned into more COVID-19 deaths. Most states have not seen a corresponding increase in deaths so far, but the next month will show whether that bad scenario will be true.

The increase in positive cases alone has caused some states to pause their reopening and a few have even gone backwards and shut down previously reopened industries, such as bars and restaurants. The increase in positive cases could also cause Americans to be more worried, and to continue to stay home and spend less money regardless of whether states impose new restrictions. Under that scenario, not only would the improvements in the labor market cease, they could go the other direction and July could see a higher unemployment rate.

What data can we look at in the meantime while we wait for the July unemployment report, which is still about a month away? One resource I recommend is the Opportunity Insights Economic Tracker, created by researchers at Harvard. This tool provides data on consumer spending, small business revenue, and several other useful resources that is continuously updated as new data becomes available.

The consumer spending data is currently updated through June 24. While it shows that consumer spending is still about 7% below its pre-pandemic levels, that’s a huge improvement from being down 30% in early April. This tool is also nice because it allows you to look at individual states. Arkansas has been back to pre-pandemic consumer spending levels for about a month, though we can also see that spending at restaurants in Arkansas is still down about 23%.

By watching the data on the Opportunity Insights tool as it comes out, we can get a better sense of where the labor market and the U.S. economy is heading. In addition to consumer spending in that tool, keep your eye on the three business indicators they track — small business revenue, small businesses open, and job postings — as well as the “time outside home” indicator to see how much people are moving around in the country and in individual states.

While these measures don’t tell us directly how many people are unemployed, they give us a sense where the economy is heading. There is also data available on the number of people filing unemployment insurance claims. It is difficult to directly translate this into how many people are unemployed, but it is worth tracking too. The Insured Unemployment Rate tells us what percent of the labor force is currently collecting unemployment insurance benefits, and it is updated weekly. The changes in this measure can give us some indication of where the labor market numbers are heading and what we might see in the next BLS monthly labor market report.

One final thing to keep in mind with unemployment insurance: As part of the CARES Act passed by Congress in March 2020, individuals who lose their job and are eligible for unemployment insurance have also been receiving an additional $600 per week on top of their normal state benefits. Unless Congress extends it, that additional $600 per week payment is set to end at the end of July.

While we don’t know if Congress will extend it, end it, or modify it in some way, we can make some predictions about what happens if the $600 per week payment does go away. One major possibility is that many workers would return to their jobs once the benefits expire. The expanded weekly benefits provide some incentive to stay home, which is part of the intuition behind providing it in this crisis, and without the payments some workers may be more willing to head back to work. But, if many businesses stay closed either due to government orders or a lack of consumer demand, those workers may have no jobs to return to, and they will now have much less money in their pockets to spend in the economy.

It’s hard to say which of these effects will dominate, but that’s another thing to watch for in the next few weeks as we move into August.

Jeremy Horpedahl is an assistant professor of economics at the UCA College of Business and research scholar at the Arkansas Center for Research in Economics.

Understanding Economic Data in the COVID-19 Crisis

By Jeremy Horpedahl, Ph.D.

As the country continues to deal with the COVID-19 crisis, accurate data is one of our most important tools for understanding what is happening in our country and the world. In particular, economic data can tell us a lot about how the virus and public policy response is playing out. Accurately interpreting the data is crucial so that we understand what it means.

Last year, I co-authored a book designed to help Arkansans better understand economic data. In this blog post, I will highlight a few data sources you can follow to better understanding what is happening in our country and economy.

Unlike most economic downturns, the current crisis is a largely planned economic slowdown used to encourage people to reduce contact with others. We have not seen an economic downturn like this. Even so, our conventional economic data provides a way of seeing what is happening in the world, as long as we understand what the data is telling us.

What does the stock market crash tell us?

Since Jan. 1, the S&P 500 is down about 21% through March 27. The S&P 500 is a good, broad gauge of the 500 largest publicly traded companies, and much better than the Dow Jones Industrial Average, which only covers 30 companies and is calculated strangely.

The stock market crash tells us investors are worried about the future profitability of U.S. companies. Stock prices are based on the perception of how profitable a company will be in the long run. Stock prices provide us a real-time snapshot of how the economy is doing, updated not only every day but every minute. As opposed to some of the other economic data I’ll be describing, which can take weeks or months to collect and report, the stock market gives us some information in real-time.

But stock markets can also overreact, especially in a time of great uncertainty like the present. For example, earlier in the week of March 23, the stock market was down 30%, rather than the 21% it closed out at March 27. That’s a big change in a week. Expect more big changes over the coming weeks and months. This means you can’t always depend on the stock market to tell you what is happening in the economy. It’s a noisy measurement.

And not all companies have seen their stocks decline. Zoom, a video conferencing company that many are using to stay in touch while we practice social distancing, is up 120% this year. Blue Apron, a company that delivers fresh food to be prepared at home, is up about 80% this year. Investors expect these companies to be much more profitable than they expected before the crisis hit.

It is also worth noting that stock markets are declining across the world. The U.S. is not an outlier. Stocks in Europe are down about 27% this year. Even in Japan and South Korea, which have handled the crisis relatively well, stocks are down 18% and 22% this year (all figures are through March 27). We are not alone, and not noticeably worse than any other democratic, market-based economies.

Your retirement portfolio probably looks a lot worse than it did on Jan. 1. That’s a difficult thing to see. But the overall stock market is roughly where it was in 2017, so we have not gone back to the dark ages. I recommend following the stock market as a way of seeing what is happening in the economy, but I don’t recommend checking your 401(k) balance daily.

What is the best overall measure of how the economy is doing?

Gross Domestic Product is widely viewed as the best measure of the overall economy. It is a measure of the market value of all the goods and services produced in our economy. Knowing what is happening with GDP can tell us a lot about how the economy is doing and how bad the partial shutdown of the economy has been. It’s also sometimes used to determine whether the economy is in a recession or not.

But there’s a major problem with GDP: It is only reported quarterly and takes time to compile. While the first-quarter of 2020 will be ending in a few days, we won’t have the first GDP estimate until April 29. And that is only considered an “advance” estimate, with the final estimate coming June 25. Plus, only one month of the first quarter, March, was seriously hit by the economic slowdown in the U.S.

The second-quarter is expected to be the hardest hit, but right now, we can only speculate. I’ve seen lots of estimates of how bad it will be, including the president of the St. Louis Federal Reserve saying that GDP could decline by 50%. That would be bad. The worst quarterly decline on record was in 1958, when GDP fell by 10%, also during a flu pandemic. Quarterly estimates don’t cover the Great Depression, which was much worse.

We won’t have an estimate of second-quarter GDP until July. It’s not helpful for watching what is happening in real-time.

There are economic indicators that provide some glimpse of the economy faster than GDP, and might even tell us what will happen with GDP. For example, the Conference Board produces an index that uses 10 “leading” economic indicators, such as the stock market performance and unemployment claims, to give a picture of how the economy is performing. The Conference Board releases its index monthly, and the March report is scheduled to be released on April 17.

The Federal Reserve Board’s Industrial Production Index is also released monthly and tells us how many goods the industrial sector is producing. It is narrower than GDP, since it does not include services, but it will still give us some idea of the extent of the economic downturn. The March report is scheduled for release on April 15.

How bad has the labor market been hit?

One of the most immediate impacts of the economic slowdown is that many individuals have been laid off or had their hours significantly cut back. The unemployment rate is one of the best measures of how the labor market is performing. It is released as part of the monthly Employment Situation Report from the Bureau of Labor Statistics. The unemployment rate is not a perfect measure since it only counts those looking for work as unemployed, but along with the other information in the employment report, it provides a good picture of the health of the labor market. Currently, the unemployment rate is near record lows at 3.5%, but, of course, this will be changing soon. The question is how much.

We will get a report for March on April 3. However, BLS uses a “reference week” to conduct the survey, and that reference week was March 8-14. As you may recall, that was the week before most of the U.S. began shutting down businesses and practicing social distancing. We won’t have a report for April until May 8.

How bad the unemployment rate will get is anyone’s guess. The same St. Louis Fed president that predicted GDP will decline by 50% also guessed that unemployment would hit 30%. Economists at the St. Louis Fed have produced estimates that 46% of US workers are at “high-risk” for becoming unemployed in the current crisis. These are some of the highest guesses I have seen, but remember, they are just that — guesses. We’ll have to wait for the real data to see how bad it truly is.

One measure of the labor market that is available more frequently is the new filings for unemployment insurance claims. National data are released every week, a timely measure. While this measure is not perfect, since not everyone unemployed qualifies, and not everyone eligible applies, it is useful due to how often that data is released.

On March 26, we had the release of this data for March 15-21, the first week significantly impacted by the slowdown. And it was record-breaking bad news: around 3 million Americans applied for unemployment insurance. For reference, there were fewer than 6 million total unemployed Americans before the crisis started.

The prior week, fewer than 300,000 had applied for unemployment insurance, so we had 10 times as many new unemployment claims in one week. During previous recessions, such as 1982 and 2008-2009, the weekly number never got above 700,000. Three million in one week is historic and historically bad. The next weekly report is scheduled to be released on April 2 and could be just as bad.

One of the major parts of the economic stabilization bill just passed by Congress provides support to the newly unemployed. Unemployed workers would get $600 per week from the federal government in addition to the state benefits they already qualify for, which can be as much as $451 per week in Arkansas. In a future blog post, I’ll discuss this economic stabilization bill in more detail and what it could mean for the labor market and economy.

Jeremy Horpedahl is an Assistant Professor of Economics at the University of Central Arkansas College of Business and Research Scholar at the Arkansas Center for Research in Economics. Read The Citizen’s Guide to Understanding Arkansas Economic Data here .

How To Approach the Tax Extension

Ashley Phillips, Ph.D.

In response to COVID-19, the Internal Revenue Service has extended the due date for filing 2019 federal income tax returns and remitting federal income tax payments until July 15.

This relief applies to federal income tax payments — including the payment self-employment income tax — and federal income tax returns due on April 15. The July extension is automatic. Arkansas Gov. Asa Hutchinson extended the deadline for filing state income tax returns to July 15, as well. However, the deadline for Arkansas’ estimated tax payments has not been extended.

To understand how Arkansans should approach the federal and state tax deadline extension, we spoke with Ashley Phillips, Ph.D., assistant professor of accounting, who was a tax attorney with the IRS for five years before joining the UCA College of Business in 2016.

When should a return be filed?

“Everyone should file their federal and state income tax returns as soon as possible rather than waiting until July 15. One important reason for filing your return as early as possible is to reduce the risk of tax identity theft. Filing tax returns prevents an identity thief from later electronically filing a return using your personal information to claim a fraudulent refund. The IRS is encouraging taxpayers who expect a refund to file their return as soon as possible. For those expecting a refund, filing a tax return electronically with direct deposit is the quickest way to receive the refund.

If a tax payment is due, the return may still be filed now and the tax due may be remitted closer to July 15. If you are concerned that you will not have the ability to pay the tax due, then a payment plan with the IRS should be considered. The IRS has short-term (120 days or less) payment plans and long-term (more than 120 days) installment plans. More information on these payment plans can be found on the IRS website. It is important to remember interest, penalties and additions to tax for postponed federal income tax filings and payments will begin to accrue on July 16 for returns not filed or tax payments not remitted by July 15.

If an extension of time beyond the July deadline is needed, then an application for extension should be filed on Form 4868 by July 15.”

What is the impact of the extension on estimated payments?

“All first-quarter estimated income tax payments for the 2020 tax year due on April 15 are now due July 15. The extension of time does not apply to the second-quarter estimated income tax payments due on June 15.”

What is the deadline for 2019 IRA contributions?

“The deadline for making IRA contributions for 2019 has also been extended until July 15.”

Furnishing a Nation: Supply Chain During COVID-19

Doug Voss, Ph.D.

The country’s response to COVID-19, known as the coronavirus, has seen busy times for grocery stores as Americans stockpile canned goods, non-perishable food and household supplies to prepare for more time at home.

Doug Voss, Ph.D., director of the Center for Logistics, Education, Advancement & Research and Scott E. Bennett Arkansas Highway Commission Chair, said inventory in the channel to grocery stores is plenty as most stores receive multiple loads of product a week, and some multiple shipments a day.

“Thank a truck driver next time you see one,” he said.

Voss took part in a Q&A with us to explain how the supply chain and logistics industry responds to a crisis like COVID-19.

How does the supply chain industry respond to situations like this? Does it compare to the everyday hustle with just a few more shipments, or are there certain trips in the system that brings about a change?

“Demand is the primary driver for supply chains. As demand for certain items increases, production and transportation of that item will frequently increase as well. Demand fluctuations are an everyday occurrence. The current spike in demand for some items is pretty extraordinary but manageable thanks to the hard work of our truck drivers, warehouse workers and supply chain managers.”

Many news reports show empty shelves in several stores in the past couple of weeks. Are stores running out of products too quickly? How often are stores in our area receiving shipments?

“A simplified supply chain consists of a network of suppliers, manufacturers, storage facilities, transportation service providers and retail outlets. Inventory is held by each member of this network to some degree. The bare shelves at your local retailer are caused by demand that exceeded inventory availability in a short amount of time.

However, that doesn’t mean there isn’t plenty of product. There is plenty of inventory in the supply chain for almost every product. It’s just a matter of moving that inventory from the supplier or warehouse to the supermarket where we buy our goods.

The retailer monitors real-time sales and inventory levels. The replenishment process begins when inventory gets low. The supply chain is specifically designed to quickly replenish goods. Your local supermarket may be replenished by several trucks each day with each truck delivering a specific assortment of goods for that store.

Store shelves are constantly replenished, but now that the initial COVID-19 demand spike is complete, the supply chain will be able to catch up. That’s what the system is designed to do and it does it very well. Other than hand sanitizer, there would be plenty of product to go around if we all showed a little more restraint at the store.”

What are the problems or issues that could cause issues in the supply chain?

“The ‘kinks’ that would cause this system to break down include labor shortages or other calamitous events that stop the manufacture or flow of goods. We haven’t seen anything that would shut down the supply chain yet. Things will generally go well as long as we can keep manufacturing and moving product.”

The federal government has taken steps to remove regulations in response to the crisis. Why was that seen to be necessary to deal with COVID-19?

“The federal government has suspended many regulations on trucking companies engaged in the movement of goods critical to support our medical community and societal needs. Trucks are the only mode of transportation that can deliver goods to the front door of most locations. Without trucks, everything shuts down including the ability to decontaminate drinking water.

As an example of a suspended regulation, the federal government has temporarily removed hours of service regulations for companies hauling critical freight. This effectively expands the amount of trucking capacity by allowing drivers to work more hours each day while also speeding time to market for the critical goods they carry. We are all better off if medical supplies and food are replenished faster.”

What are the issues to watch for in the next few days or weeks?

“There was a big increase in demand for trucking services following the initial surge in grocery demand. However, many other shippers — the “Big 3” auto manufacturers — have idled production and the initial consumable demand has subsided to a degree. This means that some trucking companies will have idle capacity but, perhaps more importantly, many shippers may not be able to pay their bills. Cash flow is always important but especially at this critical juncture. Companies need to avail themselves of assistance resources available from the state and federal governments.”

For more information on programs available to small businesses, click here.