By Jeremy Horpedahl, Ph.D.
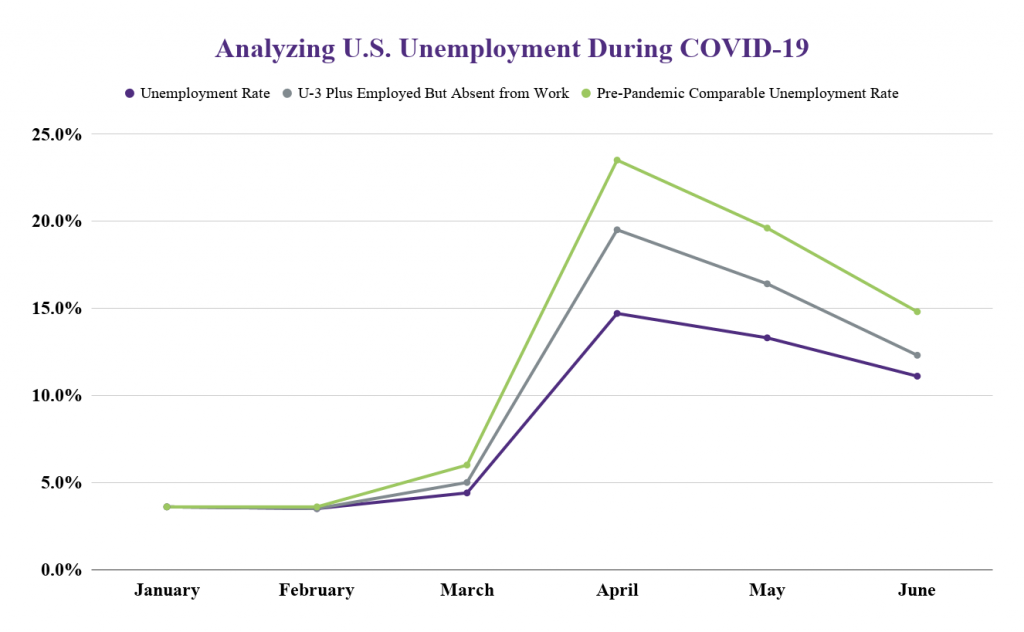
The latest data on the U.S. labor market was released on July 2 and saw the unemployment rate drop to 11.1% and nearly 5 million jobs were added in June. The unemployment rate aims to give a broad picture of how the labor market is performing. June’s rate is lower than 14.7% and 13.3% in April and May, respectively, but is still well above January and February when it was under 4%.
The unemployment rate has limitations in normal times, and during the current health and economic crisis it has even more limitations. To account for these limitations, it is useful to look at two broader measures of the number of people out of work. This allows us to see the percent of people out of work is higher than the official unemployment rate, but the trends are broadly the same: April was the worst month for the labor market, and there has been significant improvement in May and June.
What’s Wrong with the Unemployment Rate?

Jeremy Horpedahl, Ph.D.
There are two major problems with the official unemployment rate. First, is a current issue with the survey itself, which is administered by the Census Bureau. Survey takers were instructed to classify workers as unemployed (on temporary layoff) if they were not at their job due to COVID-19, but some survey takers classified these people as employed (but absent from work). BLS is aware of the problem and working to more accurately and consistently classify unemployed people correctly.
Thankfully, BLS also provides us with the data so we can reclassify these workers ourselves. That’s what the second, middle line does in the accompanying chart. Classifying all of those workers who aren’t at their job because of COVID-19, we see that these alternate unemployment rates are slightly higher: 12.3% vs. 11.1%. But the trend is the same as the official unemployment rate, and the classification problems are getting smaller over time (only about 1 million misclassified workers in June, compared with 7.5 million in April).
There is another, potentially bigger reason the unemployment rate undercounts the severity of the economic crisis: People who have dropped out of the labor force are not counted in the unemployment rate. If a worker has lost their job — not just on temporary layoff — and they are not currently looking for a new job, they don’t exist for purposes of calculating the official unemployment rate. And there are a lot of people in this situation: currently over 4.6 million people (though down from 8.1 million people in April).
As with the misclassified workers, BLS provides enough data that we can add these workers back in and count them as unemployed. Putting both of these groups of people into the unemployed category gives us the third highest line on the chart. This method was suggested by Michael D. Farren at the Mercatus Center, and he calls it the Pre-Pandemic Comparable Unemployment Rate. I have updated the data using his method in the accompanying chart. As we can see in the chart, this rate is higher still: 14.8% in June. But that’s a big improvement over April and May.
We don’t have similar data at the state level, so we can’t make similar adjustments to Arkansas’s unemployment rate. We do know that in May 2020, Arkansas’s unemployment rate of 9.5% was lower than the national average of 13.3%, and lower than Arkansas’s number from April, which was 10.8%.
What’s Next for the Labor Market?
Looking at the past few months of unemployment data is important for understanding how bad the pandemic has been for the U.S. labor market. But it doesn’t tell us what we really want to know: What happens next?
There is no guarantee that the unemployment rate and other alternate rates will continue to fall just because they have for two months. And I have no crystal ball to tell you what will happen next. The unemployment rate data is always a bit behind what we would like: the most recently released data was for the second week of June, and we won’t see data for the July reference week (which is July 12-18) until Aug. 7.
There are two possible scenarios for the next month in the US labor market. The first is that states continue to lift restrictions on business and personal activity, and that Americans become less concerned about the effects of COVID-19 on their own health and the health of others. People will then spend more money in the economy in general, but also more money specifically in industries that have been hit the hardest, such as leisure and hospitality. More workers will come back to their jobs, businesses will resume hiring, and the unemployment rate will continue to fall.
There is also a pessimistic scenario. The reopening of state economies appears to have led to an increase in positive COVID-19 cases in almost every state, and in a few states — such as Arkansas, Texas, and Arizona — these new cases have turned into more COVID-19 deaths. Most states have not seen a corresponding increase in deaths so far, but the next month will show whether that bad scenario will be true.
The increase in positive cases alone has caused some states to pause their reopening and a few have even gone backwards and shut down previously reopened industries, such as bars and restaurants. The increase in positive cases could also cause Americans to be more worried, and to continue to stay home and spend less money regardless of whether states impose new restrictions. Under that scenario, not only would the improvements in the labor market cease, they could go the other direction and July could see a higher unemployment rate.
What data can we look at in the meantime while we wait for the July unemployment report, which is still about a month away? One resource I recommend is the Opportunity Insights Economic Tracker, created by researchers at Harvard. This tool provides data on consumer spending, small business revenue, and several other useful resources that is continuously updated as new data becomes available.
The consumer spending data is currently updated through June 24. While it shows that consumer spending is still about 7% below its pre-pandemic levels, that’s a huge improvement from being down 30% in early April. This tool is also nice because it allows you to look at individual states. Arkansas has been back to pre-pandemic consumer spending levels for about a month, though we can also see that spending at restaurants in Arkansas is still down about 23%.
By watching the data on the Opportunity Insights tool as it comes out, we can get a better sense of where the labor market and the U.S. economy is heading. In addition to consumer spending in that tool, keep your eye on the three business indicators they track — small business revenue, small businesses open, and job postings — as well as the “time outside home” indicator to see how much people are moving around in the country and in individual states.
While these measures don’t tell us directly how many people are unemployed, they give us a sense where the economy is heading. There is also data available on the number of people filing unemployment insurance claims. It is difficult to directly translate this into how many people are unemployed, but it is worth tracking too. The Insured Unemployment Rate tells us what percent of the labor force is currently collecting unemployment insurance benefits, and it is updated weekly. The changes in this measure can give us some indication of where the labor market numbers are heading and what we might see in the next BLS monthly labor market report.
One final thing to keep in mind with unemployment insurance: As part of the CARES Act passed by Congress in March 2020, individuals who lose their job and are eligible for unemployment insurance have also been receiving an additional $600 per week on top of their normal state benefits. Unless Congress extends it, that additional $600 per week payment is set to end at the end of July.
While we don’t know if Congress will extend it, end it, or modify it in some way, we can make some predictions about what happens if the $600 per week payment does go away. One major possibility is that many workers would return to their jobs once the benefits expire. The expanded weekly benefits provide some incentive to stay home, which is part of the intuition behind providing it in this crisis, and without the payments some workers may be more willing to head back to work. But, if many businesses stay closed either due to government orders or a lack of consumer demand, those workers may have no jobs to return to, and they will now have much less money in their pockets to spend in the economy.
It’s hard to say which of these effects will dominate, but that’s another thing to watch for in the next few weeks as we move into August.
Jeremy Horpedahl is an assistant professor of economics at the UCA College of Business and research scholar at the Arkansas Center for Research in Economics.