The following is an excerpt from: 2025 UCA Field School at St. Joseph Center of Arkansas: Preliminary Investigations at the Belmont Site (3PU1144). Report submitted to the St. Joseph Center of Arkansas and the Arkansas Archeological Survey.
This report summarizes results of preliminary survey and excavation investigations undertaken at the Belmont site (3PU1144) located on the grounds of the St. Joseph Center of Arkansas (SJCA) from May 12 through 22, 2025. Preliminary field work was undertaken as part of the University of Central Arkansas (UCA) Field Archaeology (ANTH 4480) course offered by the Department of Sociology, Criminology, and Anthropology (SCA) with assistance from the Jamie C. Brandon Center for Archaeological Research (JCB Center). The UCA field archaeology course (herein UCA field school) has a history of empowering students with a fundamental knowledgebase they can use for research projects during their undergraduate studies and after they graduate (Hebda 2022; see McKinnon 2024; Brownlow and McKinnon 2025). Participation provides students with an opportunity to directly learn about the history of a landscape by immersing into that landscape. It inspires students to think about active landscapes in their daily lives and the need for students to directly engage with diverse cultures and histories within their community and ‘cultural backyard’ (Ramos and Duganne 2000).
Fundamentally, archaeology is a public endeavor and is uniquely dependent on first-hand experience and training. This is summed up nicely by 2022 UCA field school student Emilee Burroughs who states there is “such a deeper understanding when you see it right in front of you” (Hebda 2022:15). Five UCA students participated in the 2025 field school and were instructed by Dr. Duncan McKinnon, associate professor of anthropology at UCA and director of the JCB Center. During the field portion (first two weeks), students commuted daily from Conway to spend five to six hours at the site learning about field-based archaeological method. The third week was spent in the JCB Center archaeological lab on UCA campus with an emphasis on lab-based archaeological method associated with artifact documentation, cataloging, digital data processing, and the process in which artifacts move from the field to curation and accession. In sum, students were exposed to various field and lab methods that emphasize the multidisciplinary focus that defines the discipline, the importance of site conservation and preservation, and how these concepts are applied using scientific research methodology.
Recent archival research has summarized the short history (1917-1921) of the “boomtown” of Belmont and its relationship to Camp Pike and the St. Joseph Orphanage (Fuentes 2020; Whithead 2019). Belmont was a town that was “built to be a destination from the start, and to rival the entertainment, style, and comfort anything Little Rock could offer [and] was envisioned as a source of clean entertainment, lacking the less tasteful vices of alcohol, gambling and other dangerous activities” (Whitehead 2019:11-12). Some of the entertainment available to visitors included a skating rink, a movie theatre, a baseball diamond, department stores, cafes, sweet shops, and pool halls (Fuentes 2020; Whitehead 2019). Several roads and walking paths connected these buildings to with those on the Camp Pike grounds (Figure 1).
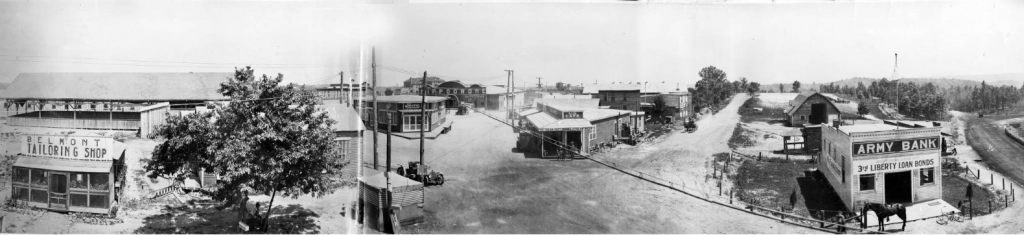
Figure 1. Panorama of the town of Belmont ca. 1918.
Today, almost all the buildings that once defined the town of Belmont have long since been removed or repurposed elsewhere. Roads have grown over with vegetation and are in disuse or being used as private pasture access on the SJCA grounds. What remains are minor indications of a once active space in the form of exposed surface artifacts and portions of poured foundations or sandstone features largely “obscured by high grasses, shrubs, or trees” (Fuentes 2020:53).
In addition to archival research, preliminary field mapping has been undertaken at the site to map the type and distribution of former building remains (Fuentes 2020; Null 2017; Pesce and Stoops 2019; Whitehead 2019). As a component of these initial field investigations, a “grid was established over the project area, labeled, and areas selected randomly and judgmentally for survey work” (Fuentes 2020:7; Figure 2a). The grid was created using a Geographic Information System (GIS), or top-down approach, where a series of 30 x 30-meter squares was superimposed over the study area using an ArcGIS fishnet. No reference datum was established on the surface (a bottom-up approach). Instead, ground reference to the GIS grid was accomplished using a GPS app (Coordinates-GPS Formatter) on a phone (Fuentes 2020:53). A simplified (judgmentally) pedestrian survey documented the generalized location of select visible features related to former Belmont buildings.
From this and archival data, designated areas of interest were plotted in which “additional testing methods are required in the future to completely investigate” the presence or absence of former buildings (Fuentes 2020:66). Additionally, Fuentes (2020) illustrates and categorizes three types of building remains. These include known foundations, suspected building locations, and probable building locations. The 2025 field school was focused within and proximate to a designated area of interest (herein AOI-1) in the northwest portion of Belmont associated with grids 538, 539, 527, 528, and where a series of four “probable building locations” are suggested (Figure 2b).
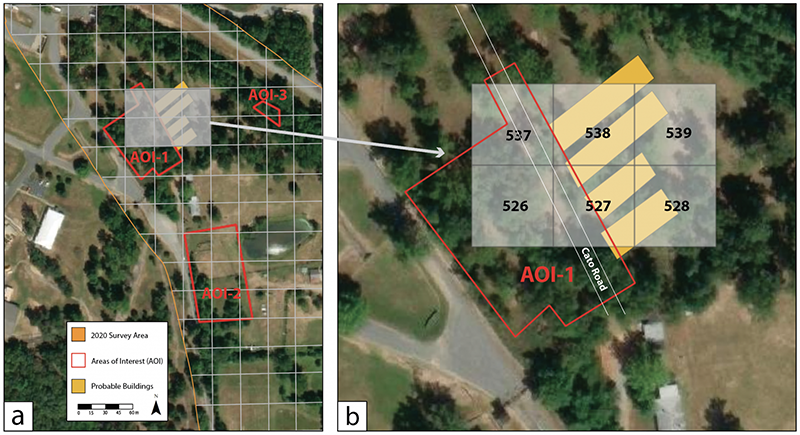
Figure 2. (a) 30 x 30-meter grid in the northwest corner of the town of Belmont showing three Areas of Interest (adapted from Fuentes 2020: Figure 1.4). (b) Location of 2025 field school investigations along the former Cato Road. Yellow polygons represent “probable building locations” (Fuentes 2020).
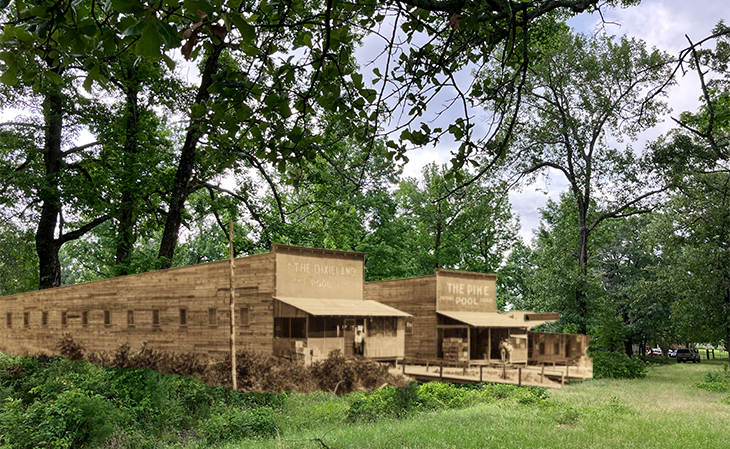
In AOI-1, historic images document the location of the Dixie Land and Pike pool halls along the north side of the now-abandoned Cato Road. (Figure 3a). The two long buildings have large covered front porch areas with a wooden “foot bridge” spanning a large drainage ditch allowing pedestrians access to Cato Road. Several stacks of cartons are visible on the edge of each porch, which are likely soda glass bottle cartons (since Belmont was advertised as a “clean entertainment” location). Individuals are standing along the porches, which provides a basic reference that can be used as a working model for scale. If one considers the average height of an adult male in 1917 at 5 ft 6 in (167 cm), then the width of each pool hall is roughly 15 to 16 ft wide and 50 to 60 ft long (see Rowntree 1942). This assessment aligns with the space needed to hold several pool tables where a typical 8-foot pool table requires a room size of at least 17 x 13.5 ft. Buildings likely also included space for seating, tables for food and drink, and possibly other games or various other amenities. Each of the Dixie Land and Pike pool halls perhaps held between four to five tables with bench seats and accessibility to move throughout the building along each wall, which was a common layout during the Belmont period (Figure 3b).
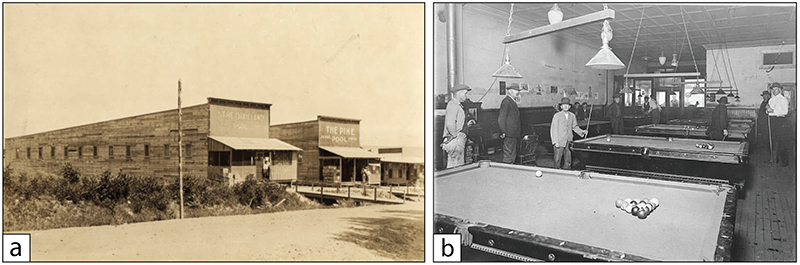
Figure 3. (a) Historic image of the Dixie Land and Pike pool halls situated along Cato Road. Original photo available at The Butler Center for Arkansas Studies (b) An example of the organization of an early twentieth century pool hall.
Two primary objectives guided the 2025 field school data collection. Both were applied, systematic, and pedagogical in their approach, which enabled field school students to learn various field archaeology applications using a formulated hypothesis and testing methodology. The first objective was concerned with evaluating the extent of subsurface visibility of the pool hall buildings using an electrical resistivity survey method (Somers 2006). Four 20 x 20-meter grids (0.16 ha; 0.39 acres) of electrical resistivity were collected (Figure 4a). Results highlight several rectilinear and regularly patterned subsurface resistivity anomalies interpreted as architectural in origin and the result of ground modifications associated with former buildings or other constructed features.
The second objective was concerned with subsurface testing using standard archaeological excavation methods (Hester et al. 1997). Three types of targeted and systematic excavation methods were used to evaluate feature preservation and the types, function, and distribution of artifacts related to the Belmont period (Figure 4b). First, two 1 x 2-meter excavation test units (TU 1, TU2) were placed over visible linear stone surface features, which were aligned with Cato Road. Additionally, three 1 x 1-meter excavation test units (TU 3, TU4, TU5) were opened to ‘ground truth’ three electrical resistivity survey anomalies. Second, ten shovel test pits were dug along two transects, where each shovel test was spaced five meters apart. Third, a metal detecting survey was established in a small 5 x 5 test area in the northwest corner of the project area.
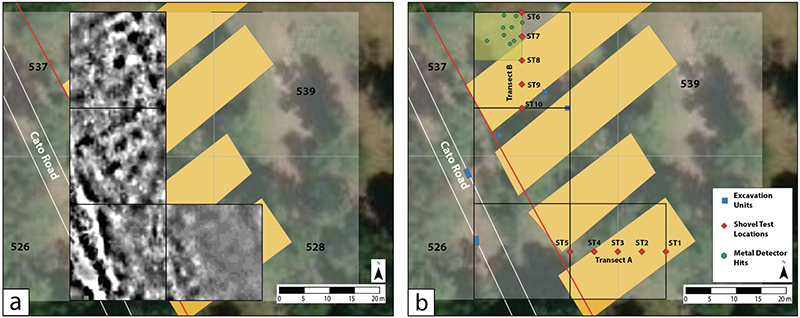
Figure 4. (a) Extent of electrical resistivity survey over proposed area of the Dixie Land and Pike pool halls along Cato Road (b) Location of excavation units, shovel tests, and 5 x 5 metal detector test area.
OBJECTIVE #1: ELECTRICAL RESISTIVITY SURVEY
The use of terrestrial-based remote sensing methods in archaeology (archaeogeophysics) is an applied discipline with the use of data to interpret landform changes, guide excavation, and establish subsurface distribution maps of cultural and natural features (see McKinnon and Haley 2017). Several methods are utilized, which include magnetic gradiometry, electrical resistance, ground-penetrating radar, and magnetic susceptibility (see Johnson 2006). For the 2025 field school, an electrical resistivity survey was undertaken.
Electrical resistivity surveys measure the level of resistance (R) in the subsurface by injecting a current (I) into the ground using a low voltage (V) resistance meter. The ratio of current to voltage defines resistance and is expressed by Ohm’s Law, mathematically stating that R=I/V. While resistance is an electrical quality, resistivity is the actual specific property of the material. Its conversion allows for the “resistance of different materials to be compared in a standardized way” (Clark 1996:27). Electrical resistivity is measured in ohm-meters.
Variations in resistance measurements are based on the principle that geological features hold different materials and amounts of moisture. Both exhibit varying levels of resistance to an electrical current, and the latter has a particularly large effect at archaeological sites. As a general principle, these varying levels of high resistance (low conductivity) might represent a shallow subsurface of compressed soil matrix, such as a compacted buried surface where porosity is decreased and evaporation is elevated. In contrast, a measurement of low resistance (high conductivity) might represent a pit or depression where moisture has accumulated into a more porous soil matrix and is less likely to evaporate–or at least evaporate at a slower rate. At the Belmont site, four 20 x 20-meter grids were established over the proposed locations of the Dixie Land and Pike pool halls (see Figure 4). Electrical resistivity was collected with spacing between transects (Y) and along the baselines (X) each set to half meter increments. Current (I) ranges were set to 1 mA at an output voltage (V) of 40 V allowing for a resolution of 0.0005 ohms. Students collected data by zigzag (collecting while walking back and forth) using an RM Frobisher TAR-3 resistance meter (Figure 5).
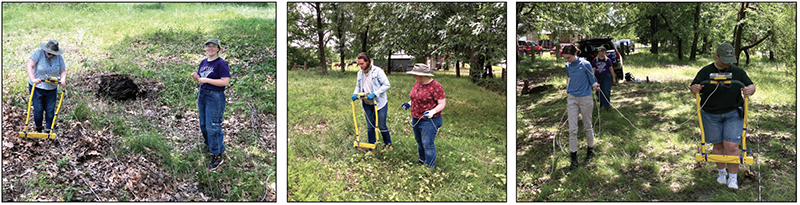
Figure 5. Students collecting resistivity data in a zigzag pattern using an RM Frobisher TAR-3.
Results reveal several electrical resistivity linear anomalies (features) situated throughout the survey area (Figure 6a). In the southwest corner of the survey area, long linear features are evident along Cato Road and clearly define the extent of the former road and its associated road ditch. A central high resistance linear feature (black) represents what remains of the original road grade, whereas the low resistance anomalies (white) are areas of the road grade that have eroded over time and “sloped” the edge of the former road. Contrasting high and low linear anomalies are also within the ditch and represent additional examples of the process of erosion, where soil and organic material from the road has accumulated within the ditch bottom over the years.
On the north side of Cato Road and the road ditch, numerous high resistance anomalies form patterns that likely represent landscape modification or architectural subsurface remains related to the Dixie Land and Pike pool hall buildings. For example, several anomalies define two possible rectilinear patterns that align with Cato Road. Using a 16 ft x 50 ft building outline as a model (the proposed size of the pool hall buildings), two groups of anomalies form rectilinear patterns that are oriented perpendicular to the road ditch (Figure 6b). Within the rectilinear features are isolated high resistance anomalies located “under” the proposed building locations and may represent the compacted remains of a series of central footings. Noticeably, there is a clear lack of electrical resistivity anomalies in the southeast corner of the survey area. This initially suggests buildings were not present in this area, or perhaps different in dimension, type of building use, and impact to the subsurface. In short, subsurface data patterns (resistivity anomalies) are present within the survey area in the form of patterned features. These groups of patterned anomalies are interpreted as former pool hall locations. Additionally, road features provide insight into current preservation of the former road and its reduction through erosional processes over the last 100 years.
Future electrical resistivity data conducted within the grids located to the east are likely to more fully define the extent of anomalies and areas occupied with buildings and architectural features. With a larger survey area, patterns and anomalies that might initially seem isolated are more readily visualized and compared. This realization defines a landscape approach to understanding a more continuous and related culturally modified space (Kvamme 2003).
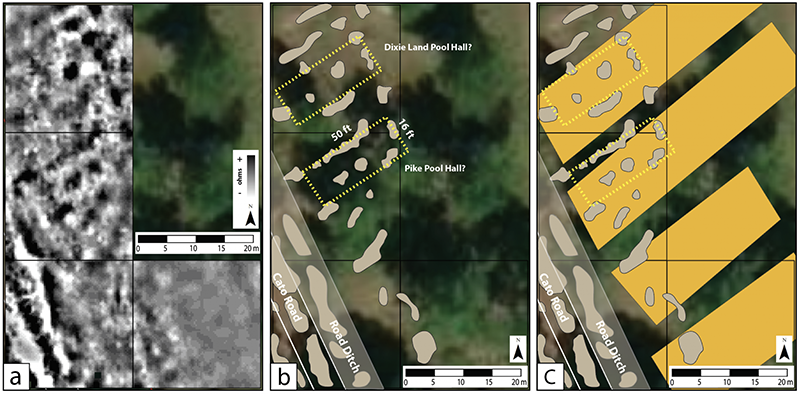
Figure 6. Electrical resistivity results and interpretations. (a) Processed data showing numerous linear and rectilinear anomalies within the survey area (b) Numerous high and low resistivity anomalies are interpreted as remains of Cato Road and possible building locations (c) Anomalies and interpretations are overlain on proposed building locations (Fuentes 2020).
OBJECTIVE #2: SUBSURFACE TESTING
The second objective was a program of subsurface testing methods using targeted excavation, shovel testing, and metal detecting. All three of these methods are regularly used archaeological applications in both academic and cultural resource management (CRM) settings (see Sebastian and Lipe 2010; King 2012; Spackman 2024; Thomas and Stone 2017; Lockhart et al. 2011). As such, students had an opportunity to learn traditional forms of archaeology (excavation), as well as more specific testing methods, their challenges, and application to different types of sites and related research questions (Figure 7).
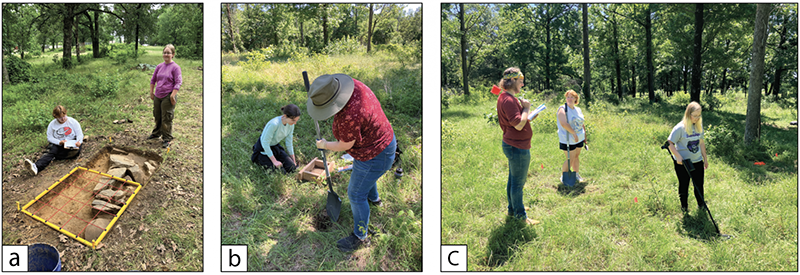
Figure 7. Examples of students learning subsurface testing methods (a) targeted excavation (b) shovel testing (c) systematic metal detecting.
Targeted Excavation
Selection of targeted excavation test units (TU) was guided by both visible surface features and results from the electrical resistivity survey. Five units were opened over the course of two weeks where students worked in teams to excavate and document findings. All units were dug in 10 cm arbitrary strata levels where each unit was terminated largely as a factor of available time. Excavated soil was screened using a 1/4-inch mesh screen and Mussell soil color values were recorded in the four corners and center of each 10 cm level. Level sheets were used to record attributes related to any visible features (cultural or natural), soil color and form (clay, loam, etc.), types and density of artifacts recovered, and vertical position. Photographs were taken at each level in addition to the creation of level sketch maps. After all data were collected, units were backfilled.
Two 1 x 2-meter excavation test units (TU 1, TU2) were placed over visible linear stone surface features aligned with Cato Road. One feature was located on the north and a second on the south side of the roadbed (Figure 8). In that students may understand various challenges with excavation, surface topography, and feature orientation, one unit (TU 1) was aligned to the site grid (with no bias toward feature orientation). The second (TU2) was aligned arbitrarily to the visible feature (with no bias toward grid orientation). The guiding hypothesis was each feature may represent dedicated stone “landings” for elevated walkways that allowed pedestrians to cross between the road and buildings. These elevated walkways are visible in the historic image of the Dixie Land and Pike pool halls (see Figure 3a).
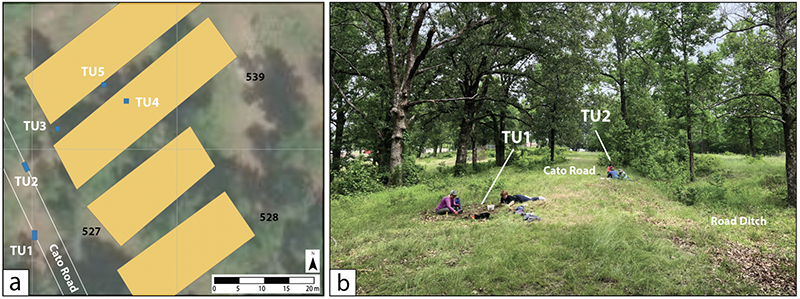
Figure 8. (a) Location of excavation test units opened during the 2025 field school (b) Location of TU1 and TU2 along Cato Road.
Within TU1 and TU2, students excavated a single level with a maximum depth of 10 cm to expose the extent and orientation of the visible stone features across each unit (Figure 9). Results reveal a series of deliberately placed stones that form a road revetment and align with the former edge of Cato Road. Stones had been “dry placed” without the use of mortar or cement. A series of larger stones is oriented along the edge of the road with smaller stacked stones moving inward to form the base of the roadbed. Excavations demonstrate the two stone features are associated with the construction of Cato Road instead of a set of dedicated landings to support elevated walkways. Surface walking along Cato Road revealed additional visible stones which align with those exposed in TU1 and TU2. This suggests the road was constructed with stone revetments along its entire length. A small likely early twentieth century whiteware ceramic sherd was collected (see Worthy 1982), along with two spent shell primers with a headstamp of “u” (post 1941; see Gleichman and Teegarden 2005). No artifacts were recovered in TU2.
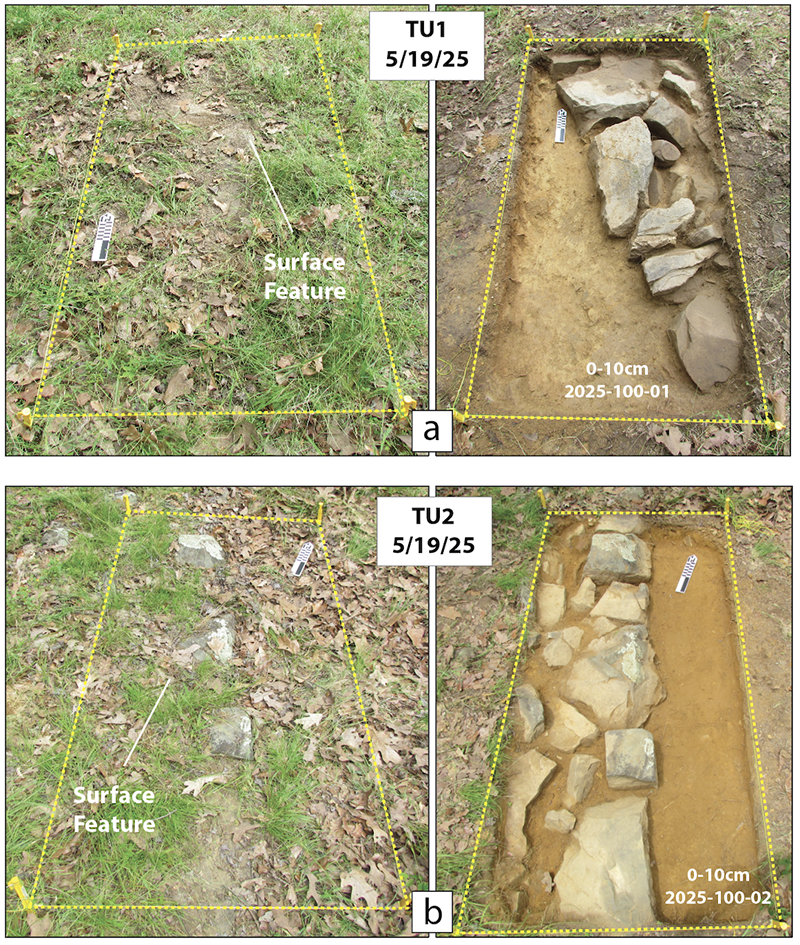
Figure 9. TU1 and TU2 excavation units document linear stone revetment features along the edge of Cato Road (a) Before and after of TU1(b) Before and after of TU2.
Three 1 x 1-meter excavation test units (TU 3, TU4, TU5) were opened on the north side of Cato Road within the proposed area of the Dixie Land and Pike pool halls (see Figure 8a). Unit locations were selected to test three electrical resistivity anomalies of different type and location (Figure 10). TU3 was established to test a large anomaly along the edge of the road ditch, which also contained visible surface stones. TU4 was established to test an anomaly along what was initially interpreted as the back of the pool hall building (see Figure 6b). TU5 was established to test a unique anomaly containing a high resistivity center with a low resistance halo.
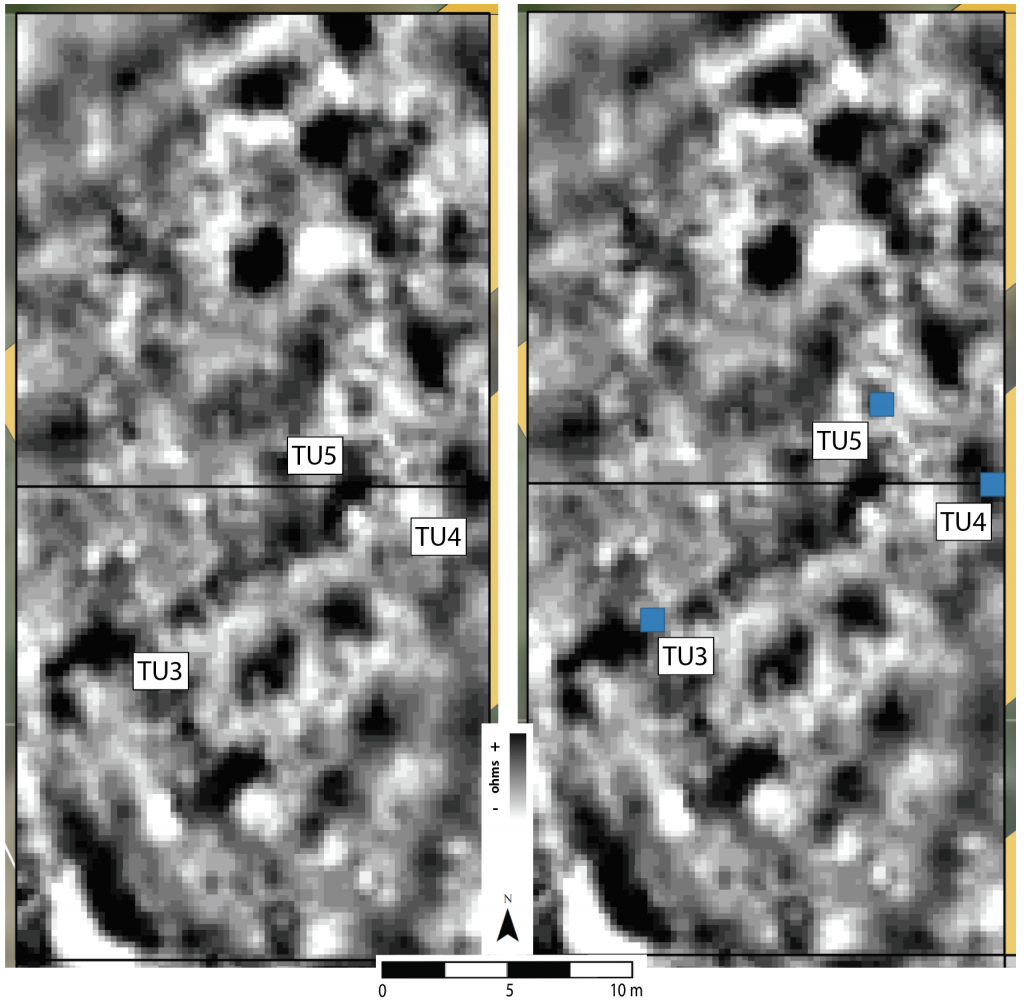
Figure 10. Location of excavation test units and associated electrical resistivity anomalies.
TU3 was opened to test the extent of visible stone features as a possible landing for the elevated walkway. Results demonstrate the stones are not ‘in situ’ and are within a highly disturbed area. There was no indication the area was the location of a walkway landing. Excavation included a single 10 cm level and was terminated at sterile clay soil at the base of the stones (Figure 11). The only artifact recovered was a single metal ‘crown cap’ bottle cap (see Riley 1958).
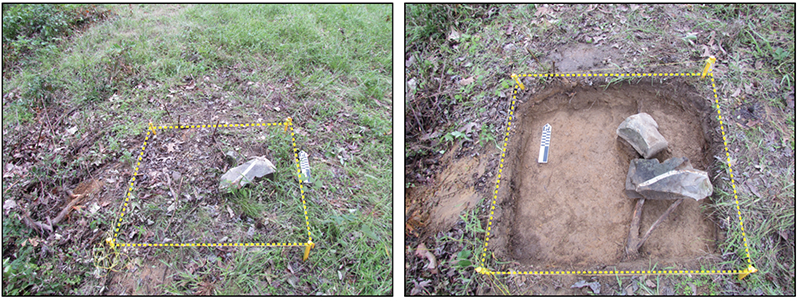
Figure 11. Before and after images of TU3.
TU4 was opened to test an electrical resistivity anomaly located along the eastern edge of the survey (see Figure 10). The area was initially interpreted to be the back extent of the former building and tested to determine if architectural subsurface features were present. Students excavated two 10 cm levels (Figure 12). At each level, students documented various attributes related to artifact type, soil coloration and type, density of artifacts, and possible features. While no clear architectural features were identified, historic items related to building construction were recovered. Level 1 (2025-100-06) was established between 0 – 10 cm and contained clear (colorless) and brown glass (n = 11, 31.0 g) and nails (n = 7, 12.0 g). Level II (2025-100-11) was 10 – 20 cm in depth and contained clear (colorless) and brown glass (n = 17, 29.8 g), nails (n = 8, 16.9 g), and iron fragments (n = 3, 3.3g).
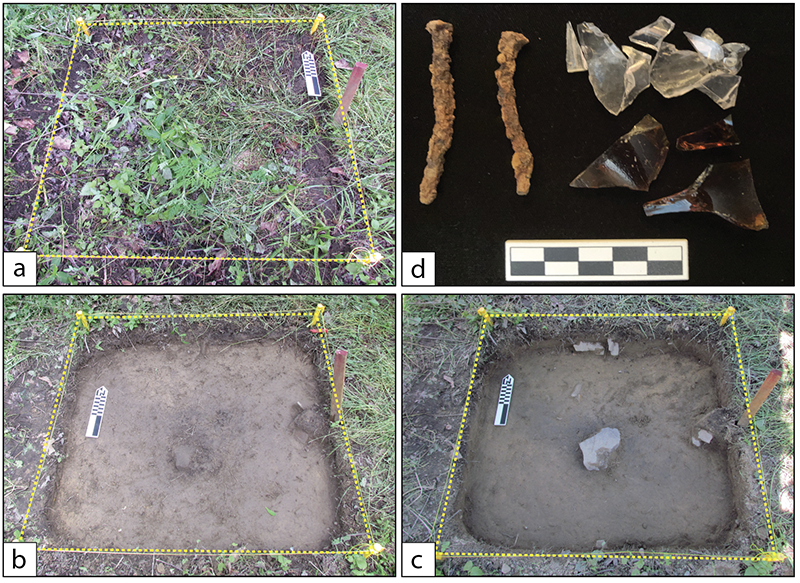
Figure 12. TU 4 excavation (a) Surface before excavation (b) 0-10 cm (c) 10-20cm (d) select artifacts recovered from Level II (10-20cm).
TU5 was opened to test a third electrical resistivity anomaly five meters northwest of TU4 (see Figure 10). Students excavated two 10 cm levels (Figure 13). At each level, students documented various attributes including artifact type, soil coloration and type, density of artifacts, and possible features. While no architectural features were identified, historic items related to building construction were also recovered in this unit. Level 1 (2025-100-10) was established between 0 – 10 cm. No artifacts were recovered in Level I. However, Level II (2025-100-12) was 10 – 20 cm in depth and contained an abundance of clear (colorless) bottle glass fragments (n = 79, 164.1 g) and three nails (25.0 g). A small soil stain was revealed in the center of the unit at the base of Level II. However, time did not allow for additional excavation and testing of the soil stain since the Level II was completed on the afternoon of the last day of the field school.
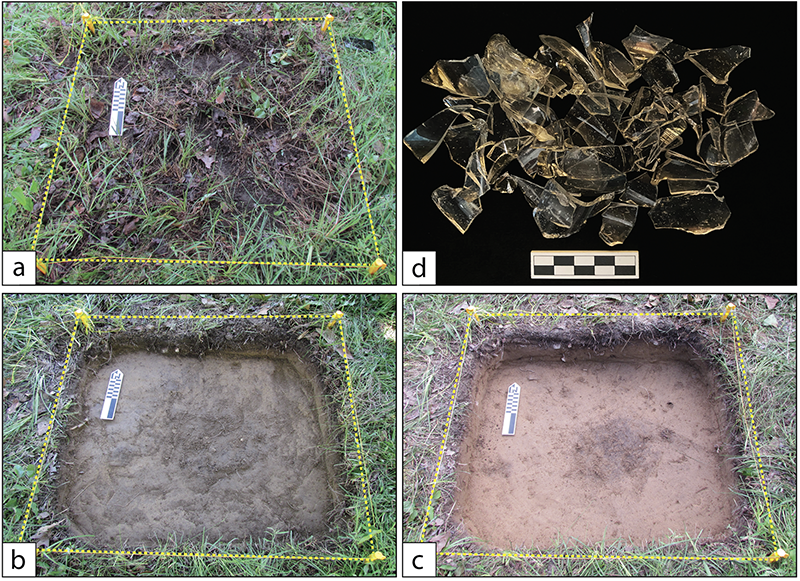
Figure 13. TU 5 excavation (a) Surface before excavation (b) 0-10 cm (c) 10-20cm (d) Colorless glass artifacts recovered from Level II (10-20cm).
Shovel Testing
Ten shovel test pits were dug along two transects. Each shovel test (ST) was spaced at five meters apart and dug using a standard spade shovel. Each ST was dug at arbitrary 10 cm strata levels until a matrix of sterile clay was encountered. Excavated soil was screened using a 1/4-inch mesh screen and Mussell soil color was recorded at each 10 cm strata. Results were documented on a standard shovel test log sheet.
Transect (A) was established along an east-west line to test artifact density and depth across an area of electrical resistivity survey in the southeast corner of the project area (see Figure 4b). The location of Transect A was chosen because of the apparent lack of subsurface features evident in electrical resistivity survey area on the eastern extent, which contrasts with numerous rectilinear features on the western extent (see Figure 6a). It was hoped that a small shovel test survey in this area could offer visibility to this apparent transition between an undisturbed and disturbed subsurface (Figure 14). No evidence of architectural features was present, and only minor artifacts recovered. Within ST2 (2025-100-04) a single clear bottle glass fragment was recovered within Stratum II (10 – 20cm). Within ST4 (2025-100-08) a fragment of a porcelain electrical insulator was recovered within Stratum IV (30 – 40 cm), highlighting that buildings connected by electrical wire were once in this location (see Myers 2010; Miller 2000). Additionally, the <30 cm depth of the insulator within Statum IV offers insights into the rate of soil development (leaf litter, seasonal brush, etc.) in this area and potential depth of additional artifacts related to the Belmont period.
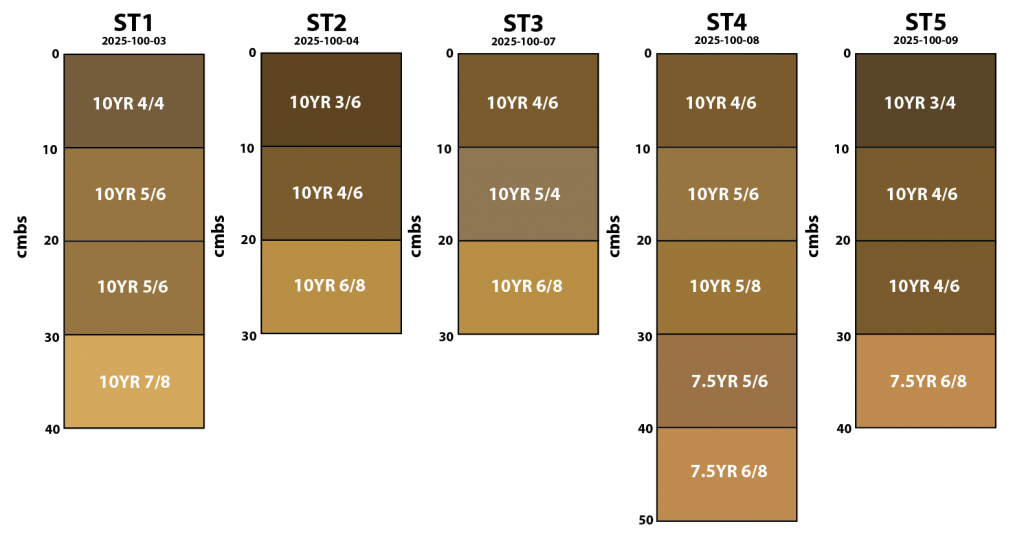
Figure 14. Shovel test results along Transect A with Munsell values provided.
Transect (B) was established along a north-south line to test artifact density and depth in the northern portion of the project area (see Figure 4b). The location of Transect B was chosen because of the high density of electrical resistivity anomalies in this area (see Figure 6a). No evidence of architectural features was documented, and only minor artifacts were recovered. Within ST9 (2025-100-16) a single brown bottle glass fragment was recovered within Stratum III (20 – 30cm). However, within ST10 (2025-100-17) numerous clear (colorless) and brown glass fragments (n = 10, 28.9g) were recovered from Stratum III and Stratum IV. The clay sterile stratum was not reached within ST10 because of time and suggests the presence of additional cultural material in deeper strata. Furthermore, the deeply buried cultural objects (>30 cm), along with data recorded in ST4, provides insights into the rate of soil development and potential depth of artifact and architectural remains associated with the Dixie Land and Pike pool halls.
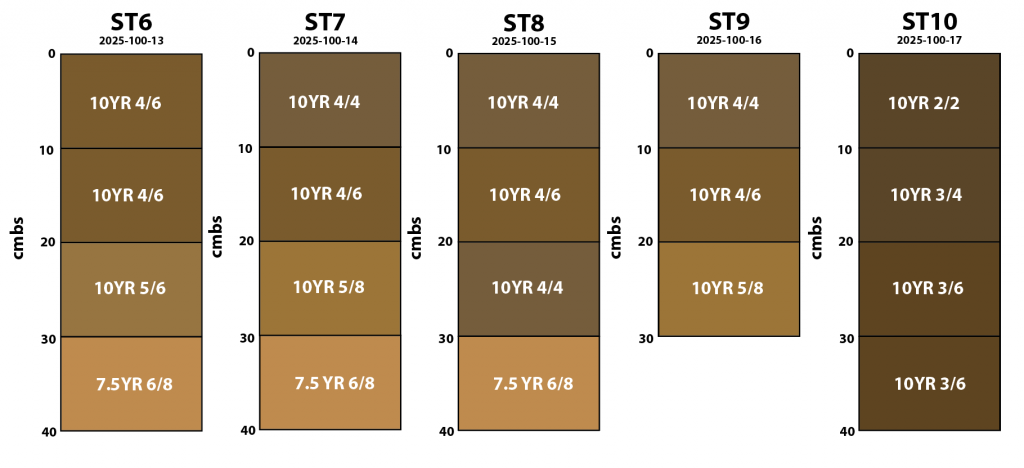
Figure 15. Shovel test results along Transect B with Munsell values provided.
Metal Detecting
A small 5 x 5-meter systematic metal detecting survey was conducted in the northwest corner of the project area to determine the extent, type, and distribution of subsurface metal objects (see Figure 4). The survey also provided students with an opportunity to understand the application of systematic metal detecting in archaeology when compared to the use of metal detectors in artifact ‘hunting’ and illegal looting of archaeological sites (see Conner and Douglas 1998; Haecker et al. 2019). The 5 x 5-meter test area was surveyed using a standard low-depth (<20 cm) metal detector and 'hits' were marked with a pin flag. Each pin flag was excavated, artifact documented (but not collected), and location mapped using a total station (Figure 16).
Results reveal numerous examples of modern aluminum fragments that are likely the result of more recent windblown trash. Fragments were recovered throughout the small survey area. Two examples of barbed wire (MD4, MD5) are likely the remains of a more recent barbed wire cattle fence that is no longer standing. In terms of Belmont-related material, two nails (MD1, MD2) and a single metal (tin) container fragment (MD7) where collected. The metal fragment is likely from a ‘sanitary’ can, which were commercially available after 1904 (see Ascher 1974; Busch 1981). Results highlight that while modern metallic objects (aluminum fragments) do exist, Belmont related items were not frequent in the survey and are likely buried at deeper depths (see ST4 and ST10).
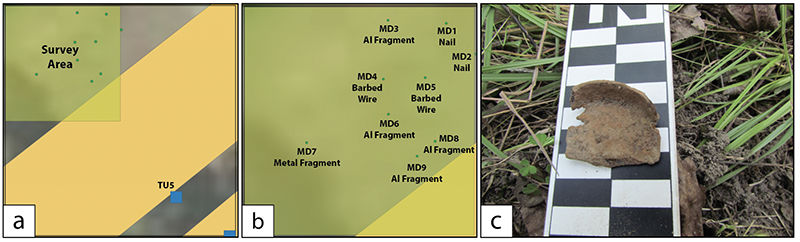
Figure 16. Metal detecting survey (a) location of survey area northwest of TU5 (b) nine “hits” were recorded with different metal objects identified (c) image of metal container fragment found in MD7.
CONCLUSION
Over the course of two weeks, UCA students had the unique opportunity to build upon previous research where it was suggested that “additional testing methods are required in the future to completely investigate” the presence or absence of former buildings (Fuentes 2020:66). The 2025 field school was conducted in an area of interest (AOI-1) in the northwest portion of Belmont associated with grids 538, 539, 527, 528, and a series of four “probable building locations” related to the Dixie Land and Pike pools halls that once existed along Cato Road within the “boomtown” of Belmont (3PU1144).
Students were able to use this opportunity to explore and apply several different archaeological methods, which included traditional excavation, electrical resistivity, shovel testing, and metal detecting, as well gain an understanding in grid layout and data point collection using a digital total station. Furthermore, this opportunity provided an applied anthropological framework to directly learn about the history of a landscape through emersion. In short, the 2025 UCA field school was applied, systematic, and pedagogical where students learned various field archaeology methods using a formulated hypothesis and testing methodology. It emphasized the multidisciplinary approach to archaeology, the importance of site conservation and preservation, and how archaeological methods are applied using scientific research methodology.
Although architectural features remain elusive, items recovered do provide a simple confirmation that the landscape was utilized in the early nineteenth century. Artifacts such as clear (colorless) and brown bottle glass and various architectural nails demonstrate this utilization (see Appendix A). Broadly, it can be assumed that the clear (colorless) and brown glass fragments collected during the 2025 field school are associated with the Dixie Land and Pike pool hall buildings. Fundamentally, the recovery of artifacts within the lower excavated levels and strata (< 20 cm) and the application of the simple law of superpositioning (Steno 1669) suggests these artifacts date to the Belmont period (1917-1921). However, while the date range of glass colors fall within the early twentieth century timeframe, further analysis of attributes beyond glass color is necessary. This is because while there is a “broad chronology of popularity of various colours [sic] over time… [color] chronology cannot be applied to individual glass objects with any significant level of meaning” (Jones and Sullivan 1989:12).
Finally, electrical resistivity results highlight several rectilinear and regularly patterned resistivity anomalies (features) that are interpreted as architectural in origin and related to the Dixie Land and Pike pool halls. From these data, new and refined proposed building locations are suggested for further testing. Along the former Cato Road, data provide insight into the construction of Cato Road and the use of stone to build revetments along the north and south sides of the road. As with any archaeological endeavor, further testing is necessary to add to these preliminary results. As such, the data collected during the 2025 UCA field school provide a framework for future testing and a hopefully a more nuanced identification of the former location of the Dixie Land and Pike pool halls.
REFERENCES CITED
Ascher, Robert
1974 Tin Can Archaeology. Historical Archaeology 8(1):7-16.
Busch, Jane
1981 An Introduction to the Tin Can. Historical Archaeology 15(1):95-104.
Clark, Anthony
1996 Seeing Beneath the Soil: Prospecting Methods in Archaeology. B. T. Batsford Ltd., London.
Conner, Melissa, and Douglas D. Scott
1998 Metal Detector Use in Archaeology: An Introduction. Historical Archaeology 32(4):76-85.
Gleichman, Peter J., and Dock M. Teegarden
2005 Cartridges, Caps, and Flints: A Primer for Archaeologists. Southwestern Lore 71(3):3-27.
Haecker, Charles M., Douglas D. Scott, and Patrick Severts
2019 Metal Detection, An Essential Remote Sensing Approach for Historical Archaeologists. Reviews in Colorado Archaeology 2(1):1-17.
Hargrave, Michael. L.
2006 Ground Truthing the Results of Geophysical Surveys. In Remote Sensing in Archaeology, An Explicitly North American Perspective, edited by Jay K. Johnson, pp. 269-304. University of Alabama Press, Tuscaloosa, Alabama.
Hester, Thomas R., Kenneth L. Feder, and Harry J. Shafer
1997 Field Methods in Archaeology. McGraw-Hill.
Johnson, Jay K. (editor)
2006 Remote Sensing in Archaeology: An Explicitly North American Perspective. University of Alabama Press, Tuscaloosa.
Jones, Olive, and Catherine Sullivan
1989 The Parks Canada Glass Glossary. Studies in Archaeology, Architecture, and History. National Historic Parks and Sites, Canadian Parks Service Environment Canada.
King, Thomas
2012 Cultural Resource Laws and Practice. AltaMira Press.
Kvamme, Kenneth
2003 Geophysical Survey as Landscape Archaeology. American Antiquity 68(3):435-457.
Lockhart, Jami J., Jerry Hilliard, Jared Pebworth, Mike Evans, Aden Jenkins, Devin Pettigrew, Duncan McKinnon, and Tim Mulvihill
2011 Archeological Reconnaissance of Selected Features at Prairie Grove Battlefield State Park. Report submitted to Arkansas State Parks & Tourism.
McKinnon, Duncan P., and Bryan S. Haley (editors)
2017 Archaeological Remote Sensing in North America: Innovative Techniques for Anthropological Applications. University of Alabama Press.
Miller, George
2000 Telling Time for Archaeologists. Northeast Historical Archaeology 29:1-22.
Myers, Adrian T.
2010 Telling Time for the Electrified: An Introduction to Porcelain Insulators and the Electrification of the American Home. Technical Briefs in Historical Archaeology 5:31-42.
Riley, John J.
1958 A History of the American Soft Drink Industry, Bottled Carbonated Beverages, 1807-1957. American Bottles of Carbonated Beverages, Washington, DC.
Rowntree, Leonard G.
1942 The Autumn General Meeting of the American Philosophical Society, November 21-22, 1941. Science 94(2450): 552-553.
Sebastian, Lynne, and William D. Lipe
2010 Archaeology and Cultural Resource Management: Visions for the Future. School for Advanced Press Research.
Spackman, Peter G.
2024 Archaeology Versus Metal Detecting. Pen and Sword History.
Somers, Lewis
2006 Resistivity Survey. In Remote Sensing in Archaeology: An Explicitly North American Perspective, edited by Jay K. Johnson, pp. 109-129. University of Alabama Press, Tuscaloosa, Alabama.
Steno, Nicolaus
1669 De Solido Intra Naturaliter Contento Dissertationis Prodomus. Florentiae : Ex typographia sub signo Stellae and Accademia della Crusca.
Thomas, Suzie, and Peter Stone
2017 Metal Detecting and Archaeology. Boydell Press.
Worthy, Linda H.
1982 Classification and Interpretation of Late-Nineteenth- and Early-Twentieth-Century Ceramics. In Archaeology of Urban America: The Search for Pattern and Process, edited by Roy S. Dickens, Jr., pp. 329-360. Academic Press.