This section, along with the other 11 chapters on the most important parts of the Arkansas economy, are authored by Jeremy Horpedahl, an ACRE scholar and assistant professor of economics at the University of Central Arkansas; Amy Fontinelle, author and editor of hundreds of public policy works; and Greg Kaza, Executive Director of the Arkansas Policy Foundation.
This section is a chapter in a larger work – The Citizen’s Guide to Understanding Arkansas Economic Data.
What are wages in Arkansas?
Wages are what employers pay for labor and are typically stated in dollars per hour. To know how much workers earn per month or per year, we need to know how many hours they work. Wages do not include the value of any additional benefits workers receive, such as health care, sick leave, and paid vacation.
Arkansas has a legal minimum wage of $9.25 per hour, approved by voters in 2018. This legal minimum is higher than the federal legal minimum of $7.25 per hour. While the legal minimum wage is often the first thing people think about when wages are mentioned, it is not relevant for the vast majority of the workforce. Nationally, only 2.3% of workers earned at or below the national minimum wage in 2017 (workers may legally be paid less if other compensation, such as tips, makes up the difference). In Arkansas, that figure is even lower, at 1.8%.1 Few other states in the South have a minimum wage above the national minimum. Missouri is the only state that borders Arkansas to have a higher minimum wage ($8.60 per hour) than the national one ($7.25 per hour), and Florida (at $8.25 per hour) does as well. All other states in the South use the national minimum.
If the legal minimum wage does not apply to most workers, how are wages determined? Economists have found that wages are closely related to worker productivity (how much they produce per hour), and that as a worker’s productivity increases, wages generally will as well. To put it another way, there is no example of a country or state increasing its wages over a long period of history without a similar rise in productivity.2 Many things determine worker productivity, but some common factors are on-the-job training, years of education, and the kind of education, such as college major, as well as the amount of capital available for the worker to use.
Why are wages important to Arkansans?
For many Arkansans, wages are the primary form of income they earn to support themselves, their families, and their communities. The Bureau of Labor Statistics (BLS) estimates that in 2017 in Arkansas, 769,000 workers out of a total 1.24 million, or about 62%, were paid hourly wages. (The remaining workers were mainly paid on salary, or on a non-hourly basis.)3
How does Arkansas rank nationally for wages?
As of 2017, the District of Columbia led the nation with a real median hourly wage of $33.82, though DC is an outlier since it is entirely a metropolitan area (metro areas have higher wages than non-metro areas). States with high wages include Alaska at $22.86 and Massachusetts at $22.81. The states with the lowest real median hourly wages in 2017 were Mississippi at $14.46, Arkansas at $14.82, and West Virginia at $15.16.4 Nationally, the median wage across all occupations in 2017 was $18.12.5
These state differences in wages partly reflect differences in the cost of living, but not completely. To adjust for this, we can use the Regional Price Parity data from the Bureau of Economic Analysis (also discussed in the Median Household Income section). For example, without adjusting for the cost of living, Arkansas’s median wage is 81.8% of the national median. After adjusting Arkansas’s median wage up to $16.96 to account for the state’s lower cost of living, its median wage is still below the national median, but it rises to a much closer 93.0%.6
Even after adjusting for cost of living differences, the states with the highest median wages—Alaska and Massachusetts—are still at the top, though they drop from about 126% of the national median to less than 120%. But some states move around quite a bit in the rankings. Ohio, Nebraska, Iowa, Missouri (Arkansas’s neighbor), Kentucky, and Alabama all move up at least 15 spots in the rankings. Other states drop dramatically: California falls from 10th to 40th place, and Hawaii from 8th to 48th. But Arkansas doesn’t move much, going from 49th to 47th place.
How do Arkansas’s wages compare to surrounding states?
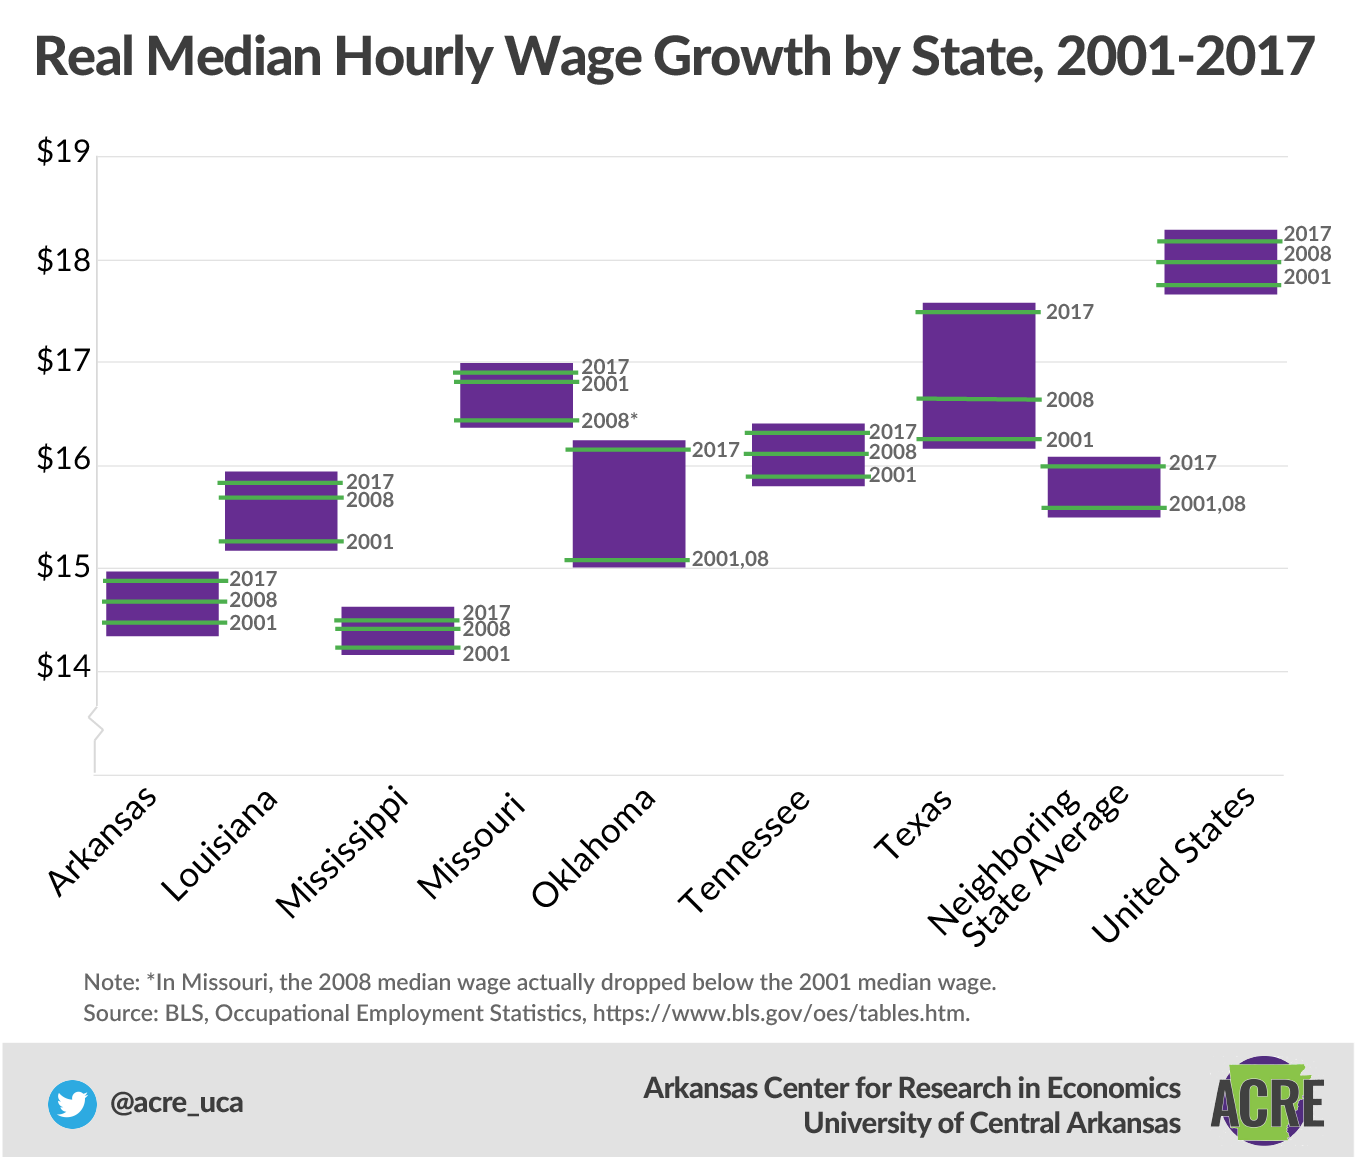
As of 2017, Arkansas had the second-lowest wages among its neighboring states at $14.82 per hour, which is about 82% of the national median (only Mississippi is lower, at $14.46). The neighboring state with the highest wages in 2017 was Texas, at $17.39 per hour. Texas workers also get to keep more of their wages since there is no state income tax.7
The surrounding state with the greatest real wage growth since 2008, when many states saw wages bottom out during the Great Recession, was Oklahoma, at 7.4%, compared to Arkansas’s 1.5%. Going back to 2001, the earliest year for which we have comparable data from the BLS, Arkansas’s median wage grew by 2.9% through 2017 in real terms. That’s about average among our neighbors, and better than the national average. These growth rates are adjusted for inflation and are total growth rates, not annual averages.8
The BLS also provides data for wage levels other than the median wage. The lowest level reported is the 10th percentile (meaning that 90% of workers make more than this wage). It is useful to analyze this wage level since we are concerned with how the least-well-off workers in Arkansas are doing in the labor market. In Arkansas, the worker in the 10th percentile earned $9.02 per hour in 2017, which is about 94% of the national wage at this percentile.9 That figure is much closer to the national level than Arkansans’ median wage. We should be careful not to attribute the closing of the gap with the national wage level to Arkansas’s higher minimum wage, however, for two reasons.
First, Arkansas has always been close to the national level at the 10th percentile, even before it raised its minimum wage (in 2011 and 2012, Arkansas’s 10th percentile wage was over 94% of the national level). Second, Arkansas is similar to its neighbors in this respect, and only Missouri has a higher minimum legal wage than the national minimum wage. All the other neighboring states use the national legal minimum of $7.25, but the 10th percentile range is from $8.40 to $9.02 per hour among Arkansas’s neighbors.10
Which occupations pay the highest and lowest wages?
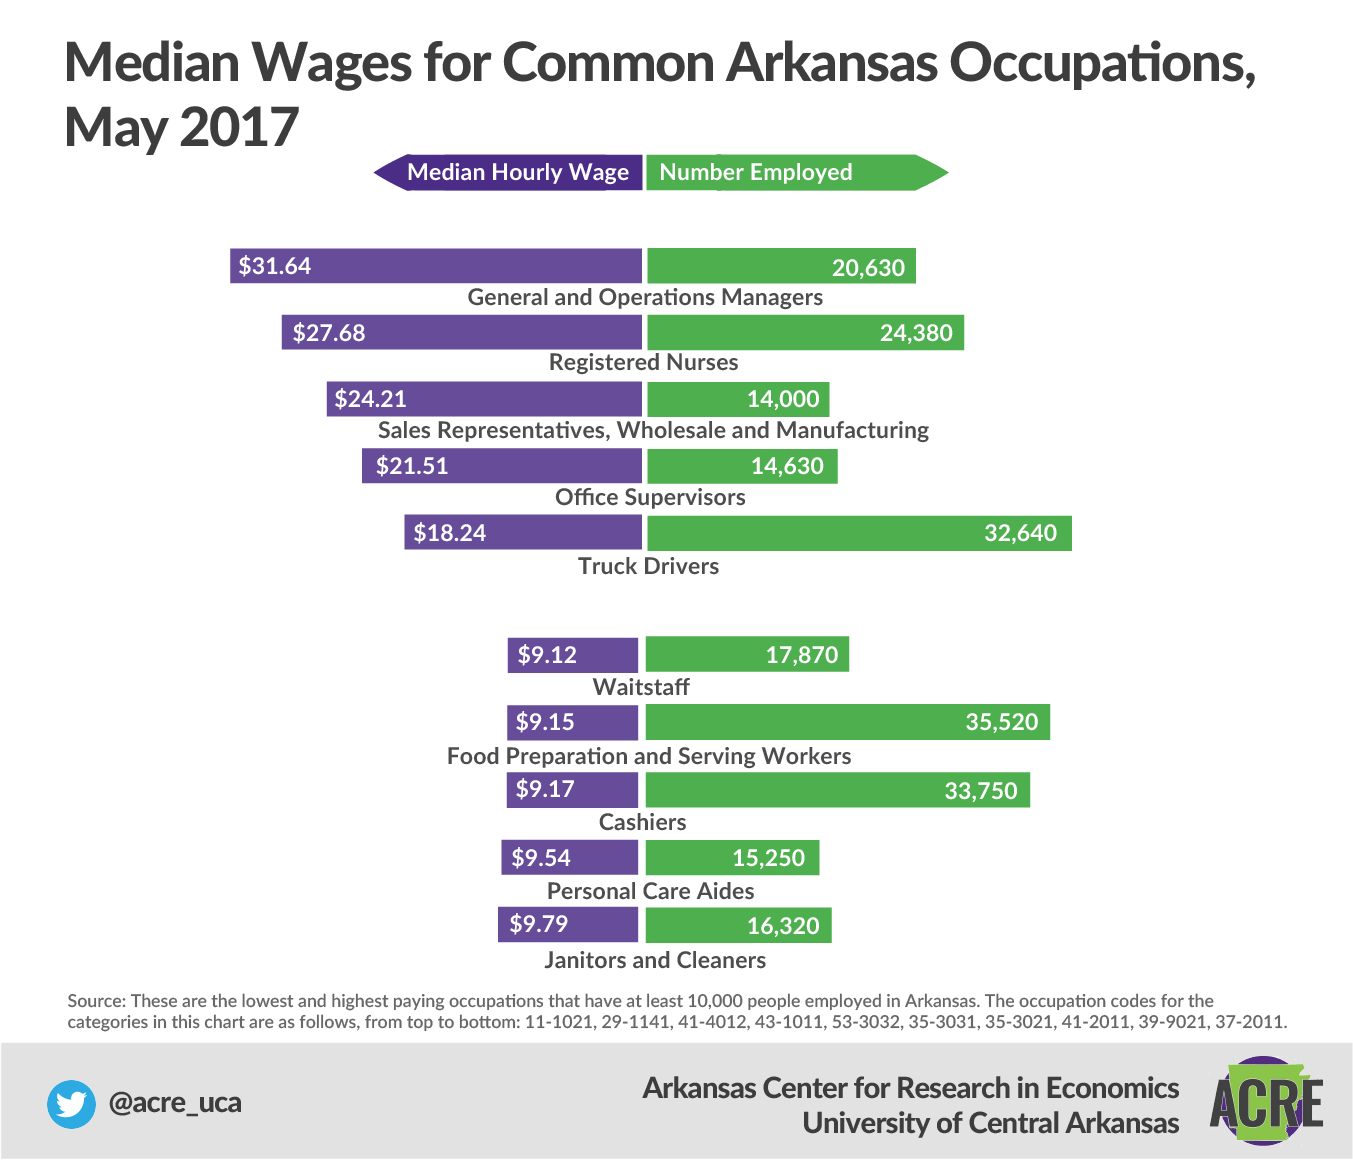
Family and general practitioners, general internists, obstetricians and gynecologists, and surgeons all earn at least $100 per hour (or $208,000 per year) and are the highest median wage occupations in Arkansas.11 Also high on the list are specialist dentists ($96.85 per hour), anesthesiologists ($90.82 per hour), and other physicians and surgeons ($90.02 per hour).12 And most if not all of these high-paying medical professions are paid on salary, not hourly.13
Amusement and recreation attendants have the lowest median hourly wages in Arkansas at $9.07 per hour.14 Also low on the list are food preparation and service workers ($9.11 per hour), waitstaff ($9.12 per hour), and a category including lifeguards, ski patrol, and other recreational protective services ($9.13 per hour).15 Some of these low-paid workers derive a large part of their income from tips, and their hourly wage directly from their employer is likely much lower, but these data reflect the inclusion of reported tips.
Which parts of the state have the highest median hourly wage?
The US Census Bureau groups Arkansas areas into metropolitan and nonmetropolitan areas, some of which overlap with neighboring states. There are six metropolitan statistical areas (MSAs) located primarily within Arkansas (the Texarkana and Memphis MSAs have more people in bordering states).
Of these six, the Little Rock MSA (which includes North Little Rock, Conway, and surrounding counties) had the highest median wage at $16.38 per hour in 2017, and the Northwest Arkansas MSA (including Fayetteville, Springdale, and Rogers) was not far behind, at $16.11 per hour. The Hot Springs MSA had the lowest median hourly wages, $12.94. The other three MSAs are Pine Bluff, Jonesboro, and Fort Smith, which had median wages of $14.87, $13.88, and $13.64 respectively.16
While the cost of living does differ slightly among these areas, adjusting the wages does not alter the order: Little Rock is still first at $18.02 and Hot Springs is still last at $15.19.17
For Arkansas counties outside of metropolitan areas, the state is divided into four areas (north, east, west, and south), and the median wages for these areas are between $13.00 and $14.00 per hour.18
What are the trends in Arkansas’s wages?
From 2008 through 2017, the real median wage in Arkansas increased just 22 cents, from $14.60 to $14.82, an increase of just 1.5%. And 2008, during the Great Recession, marks the bottom of the wage trend. Even if we go back to 2001, Arkansas’s median wages have only grown by 2.9%. That’s only about 0.2% per year, after adjusting for inflation.
By comparison, the state with the highest growth rate, North Dakota, has seen a 23% increase over the same period, from $15.65 to $19.25. Median wages for the nation as a whole increased by 2.7% from 2008 to 2017, which is nothing to celebrate, but better than Arkansas.
Workers at the 10th percentile in Arkansas fared slightly better, with real wage growth of about 8% since 2008, or just under 1% per year—just above cost-of-living increases. Still, this increase is nothing to celebrate, either, as workers are seeing hardly any increase in their real wages.19
Footnotes:
1 Bureau of Labor Statistics (BLS), “Characteristics of Minimum Wage Workers, 2017,” Report 1072, March 2018, https://www.bls.gov/opub/reports/minimumwage/2017/home.htm.
2 See Paul Krugman, Pop Internationalism, (Cambridge, MA: MIT Press, 1997), p. 55-56 for a discussion of the relationship between wages and productivity.
3 The number of hourly workers comes from BLS, “Characteristics of Minimum Wage Workers, 2017.” The total number of workers comes from BLS, “Current Employment Statistics,” Total Nonfarm Employees, average for 2017, https://www.bls.gov/sae/. These are different surveys, so the 62% figure should be seen as a rough estimate.
4 BLS, “May 2017 Occupational Employment and Wage Estimates,” https://www.bls.gov/oes/current/oessrcst.htm. BLS reports these data annually, but only for May. The raw data can be found at https://www.bls.gov/oes/special.requests/oesm17st.zip.
5 BLS, “May 2017 National Occupational Employment and Wage Estimates, United States,” https://www.bls.gov/oes/current/oes_nat.htm.
6 Regional Price Parity data come from the Bureau of Economic Analysis, “Real Personal Income for States and Metropolitan Areas, 2015,” https://www.bea.gov/newsreleases/regional/rpp/rpp_newsrelease.htm.
7 BLS, “May 2017 Occupational Employment and Wage Estimates,” https://www.bls.gov/oes/current/oessrcst.htm.
8 Historical wage data come from the BLS’s Occupational Employment Statistics data at https://www.bls.gov/oes/tables.htm.
9 BLS, “Occupational Employment Statistics,” 2017, https://www.bls.gov/oes/tables.htm.
10 State-specific data can be accessed from the BLS at https://www.bls.gov/oes/special.requests/oesm17st.zip
11 The BLS does not report the specific amount if it is over $100. All data are as of May 2017, the latest available at the time of writing.
12 Ibid.
13 BLS, “May 2017 State Occupational Employment and Wage Estimates, Arkansas,” https://www.bls.gov/oes/current/oes_ar.htm#00-0000.
14 Ibid.
15 Ibid.
16 BLS, “May 2017 Metropolitan and Nonmetropolitan Area Occupational Employment and Wage Estimates,” https://www.bls.gov/oes/current/oessrcma.htm.
17 All the Arkansas MSAs have their wages adjusted upward, since all are below the national average cost of living.
18 BLS, “May 2017 Metropolitan and Nonmetropolitan Area Occupational Employment and Wage Estimates.”
19 The data in this section are all the authors’ calculations using BLS, “Occupational Employment Statistics,” 2017, https://www.bls.gov/oes/tables.htm.
There are 12 main chapters in the book, each detailing and explaining and important part of the Arkansas economy. They are Median Household Income; Fortune 500 Companies; Economic Freedom; Personal Income; Wages; Poverty; Migration; Education Attainment; Government Revenue and Spending; Total Nonfarm Payroll Employment; Gross Domestic Product; Unemployment and Labor Force Participation
These 12 chapters were written by expert authors, including: Jeremy Horpedahl, an ACRE scholar and assistant professor of economics at the University of Central Arkansas; Amy Fontinelle, author and editor of hundreds of public policy works; and Greg Kaza, Executive Director of the Arkansas Policy Foundation.
If you are interested in sharing your thoughts and questions about Arkansas’s economy, we would love to hear from you. You can email ACRE at acre@uca.edu, tweet Dr. Jeremy Horpedahl, at @jmhorp, or comment on ACRE’s Facebook page.
If you would like a printed copy for your own home or office, please email acre@uca.edu with the subject line Printed Citizen’s Guide, and include your name, your organization’s name, and your address.