This section, along with the other 11 chapters on the most important parts of the Arkansas economy, are authored by Jeremy Horpedahl, an ACRE scholar and assistant professor of economics at the University of Central Arkansas; Amy Fontinelle, author and editor of hundreds of public policy works; and Greg Kaza, Executive Director of the Arkansas Policy Foundation.
This section is a chapter in a larger work – The Citizen’s Guide to Understanding Arkansas Economic Data.
What is the labor force?
The labor force consists of everyone who is willing and able to work. It includes both employed and unemployed individuals.1 It does not include those who are younger than 16 or who are institutionalized. Institutionalized people live in jails, prisons, hospitals, dormitories, military installations, and religious institutions.2 And the civilian labor force does not include those who are in the military.3
The labor force participation rate tells us how many working-age individuals have a job or are looking for one.4 It is calculated as the labor force divided by the civilian noninstitutional population.5
The unemployment rate is calculated as the number of unemployed people divided by the labor force.6 To be considered unemployed, an individual must have actively looked for work in the last four weeks and be currently available for work. People who have been laid off temporarily are considered unemployed even though they expect to be called back to their jobs.7
Total unemployment counts the number of people who have lost their jobs or quit their jobs, whose temporary jobs have ended, who are looking for their first job, or who are returning to the labor force after an extended absence.8
Total employment counts the number of people who are doing any work for pay or profit, whether full time, part time, or temporary and whether they work for someone else or are self-employed. Employed individuals include those who are on vacation, sick, experiencing child care problems, on maternity or paternity leave, on personal leave, involved in a labor dispute such as a strike, or unable to work due to bad weather, regardless of whether they are paid for that time off. People who work at least 15 hours a week for a business or farm operated by a family member are also counted as employed even if they are unpaid.9 An alternative way the US Department of Labor’s Bureau of Labor Statistics (BLS) counts the number of employed individuals is by surveying businesses, rather than households. All other labor force data come from surveys of households.
Unfortunately, we don’t have a way to measure how many people are underemployed: working below their skill level or working fewer hours than they’d like. If you have a master’s degree in journalism but you’re working as a barista, you’re considered underemployed. You’re also considered underemployed if you want to work full-time for a newspaper but instead you’re freelancing part-time.
The US Bureau of Labor Statistics says it is too challenging to develop objective criteria to determine how many people are underemployed: even if these people could be identified, it would be hard to measure the economic loss from underemployment.
How does Arkansas’s labor market rank nationally?
Arkansas’s 3.7% unemployment rate in 2017 is below the national average of 4.4%, and Arkansas had the 16th lowest unemployment rate among the 50 states—a positive sign for the state’s labor market. However, Arkansas’s labor force participation rate and employment-population ratio are also below the national average, which is a negative sign for our labor market. Only 58.2% of adults in Arkansas were in the labor force in 2017, and only 56.1% of them were employed. Nationally, the comparable figures were 62.8% and 60.1% in 2017. Arkansas had the fifth lowest labor force participation rate and the sixth lowest employment-population ratio in the nation in 2017.10
How can Arkansas rank well on one measure, but poorly on other measures of the labor market? Here’s one way to think about it: Arkansas doesn’t have as many of its adults in the labor force as other states, but of those that are in the labor force, most are able to find jobs. To know if this scenario is an overall good or bad indicator for Arkansas’s labor market performance, we would need to know precisely why so many Arkansans aren’t in the labor force. If it is due more to personal preference (such as a preference to stay at home with children), it may not be a worrisome outcome.
If, instead, many adults are staying out of the labor force because they don’t think they could find a job, this statistic may suggest an underlying problem. We call these people discouraged workers. They are people who want to work and are available to work, and who have looked for a job in the last 12 months, but who have given up looking over the last 4 weeks out of frustration.11 The BLS doesn’t count discouraged workers as part of the labor force.12 But BLS data show that Arkansas only has about 3,800 discouraged workers, meaning that including them as unemployed would only increase the unemployment rate by 0.2%.13
How does Arkansas’s labor force compare to surrounding states?
In 2017, Arkansas had the lowest unemployment rate among its neighboring states (tied with Tennessee at 3.7%). But Arkansas also had the second lowest labor force participation rate in 2017 among its neighboring states (after Mississippi), at 58.2%. As discussed in the previous section, we face a challenge in interpreting whether these figures are a good or bad sign for the Arkansas labor market. While a relatively low percentage of the population is actively participating in the labor force, most people who do participate are able to find a job.
Does a decline in Arkansas’s unemployment rate mean that things are improving?
Not always. The unemployment rate can decline not just when people are getting jobs, but also when the size of the labor force shrinks.14 A declining unemployment rate that’s based at least in part on a shrinking labor force is not necessarily a good thing, because when the number of people actively seeking work declines, the unemployment rate can go down even though there aren’t actually fewer unemployed workers. This can happen when people get discouraged and stop looking for work or are forced into early retirement.
People who get discouraged might also decide to go back to school or stay in school longer. For example, some students who graduated from college during the Great Recession pursued graduate degrees instead of entering the workforce, hoping that the economy would be much better by the time they earned their advanced degrees.
By contrast, a declining unemployment rate that occurs even as the labor force is growing is a good thing. It means the labor market is offering enough jobs to absorb the additional workers.15
The labor force could also shrink because people are retiring on schedule, as many baby boomers currently are.
What happens when people drop out of the labor force?
The longer people are out of work, the harder it becomes for them to get a job because they lose motivation, their skills erode, and they lose work contacts.16 These people become unemployed longterm (more than 27 weeks, by the government’s definition)17 or permanently, which can strain state government resources. For example, people who retire early because they can’t find a job might not have enough retirement savings, meaning they need to rely more on public assistance for food, housing, and health care.
How do seasonal changes affect the labor force?
The economy has regular hiring and layoff patterns based on seasons and weather. For example, businesses hire more workers during the Christmas shopping rush and the summer vacation season. These jobs are often temporary and result in layoffs when the season ends. The same is true for farm jobs, which are more plentiful during harvest season.
When we look at month-to-month changes in employment, it’s hard to tell whether the economy has fundamentally changed or the change is merely seasonal. That’s why the BLS uses a statistical technique to generate seasonally adjusted unemployment rates.18 This allows us to look at month-to-month changes and see if the unemployment situation is getting better or worse, as opposed to observing regular seasonal fluctuations.
What are the trends in Arkansas’s labor force?
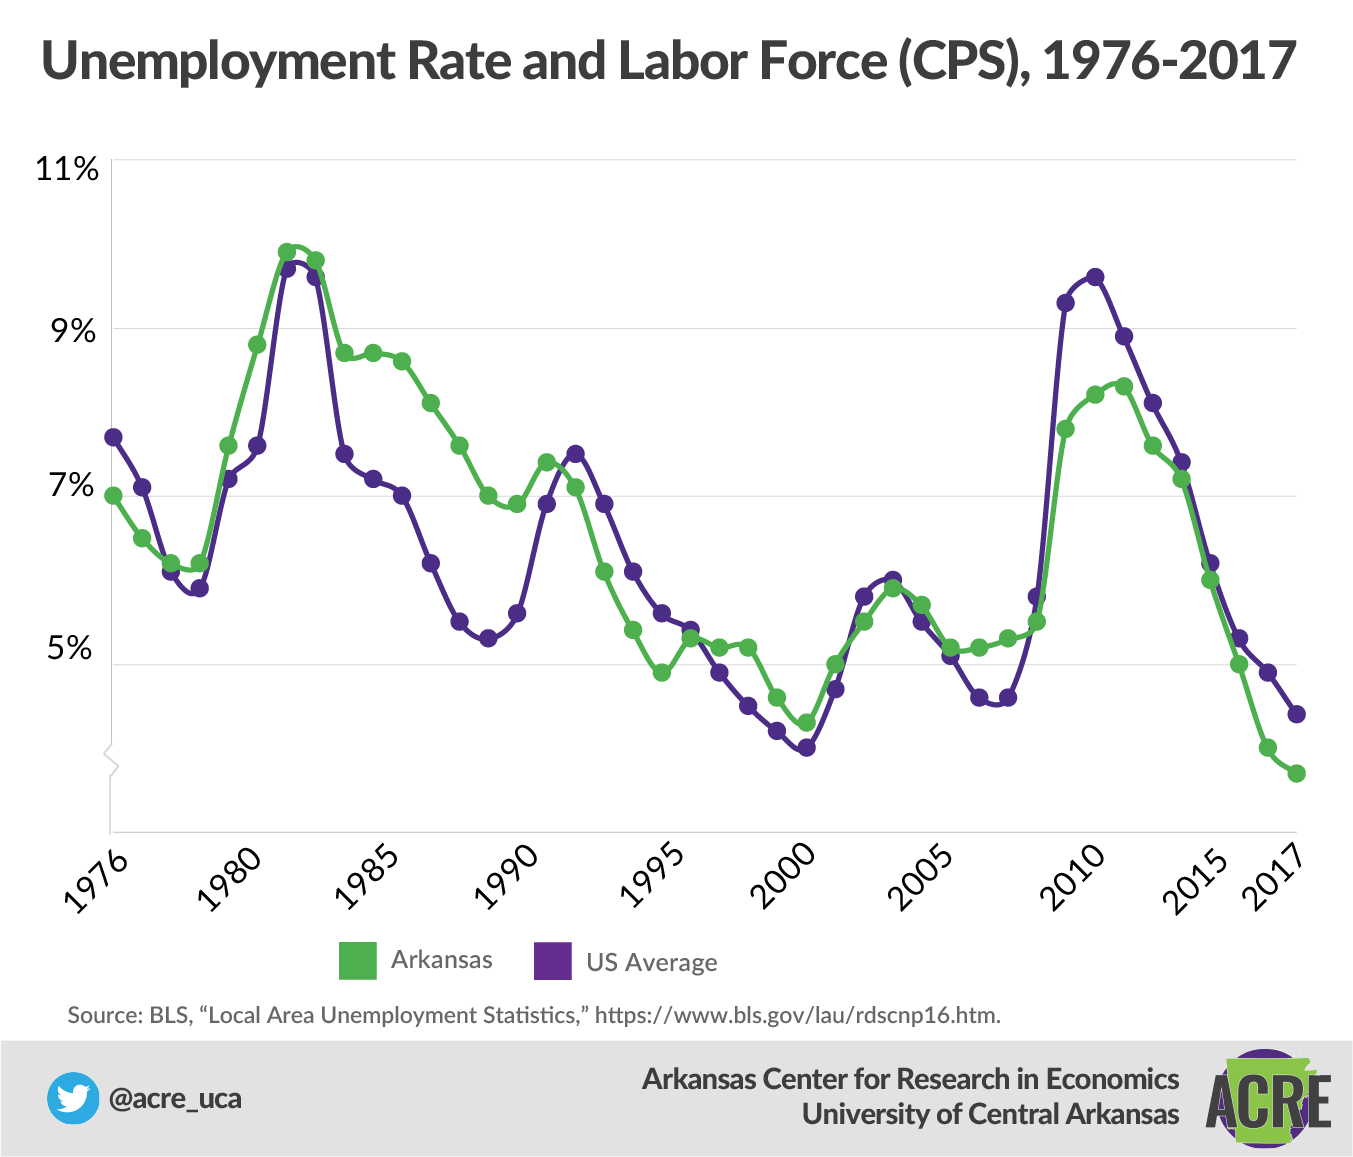
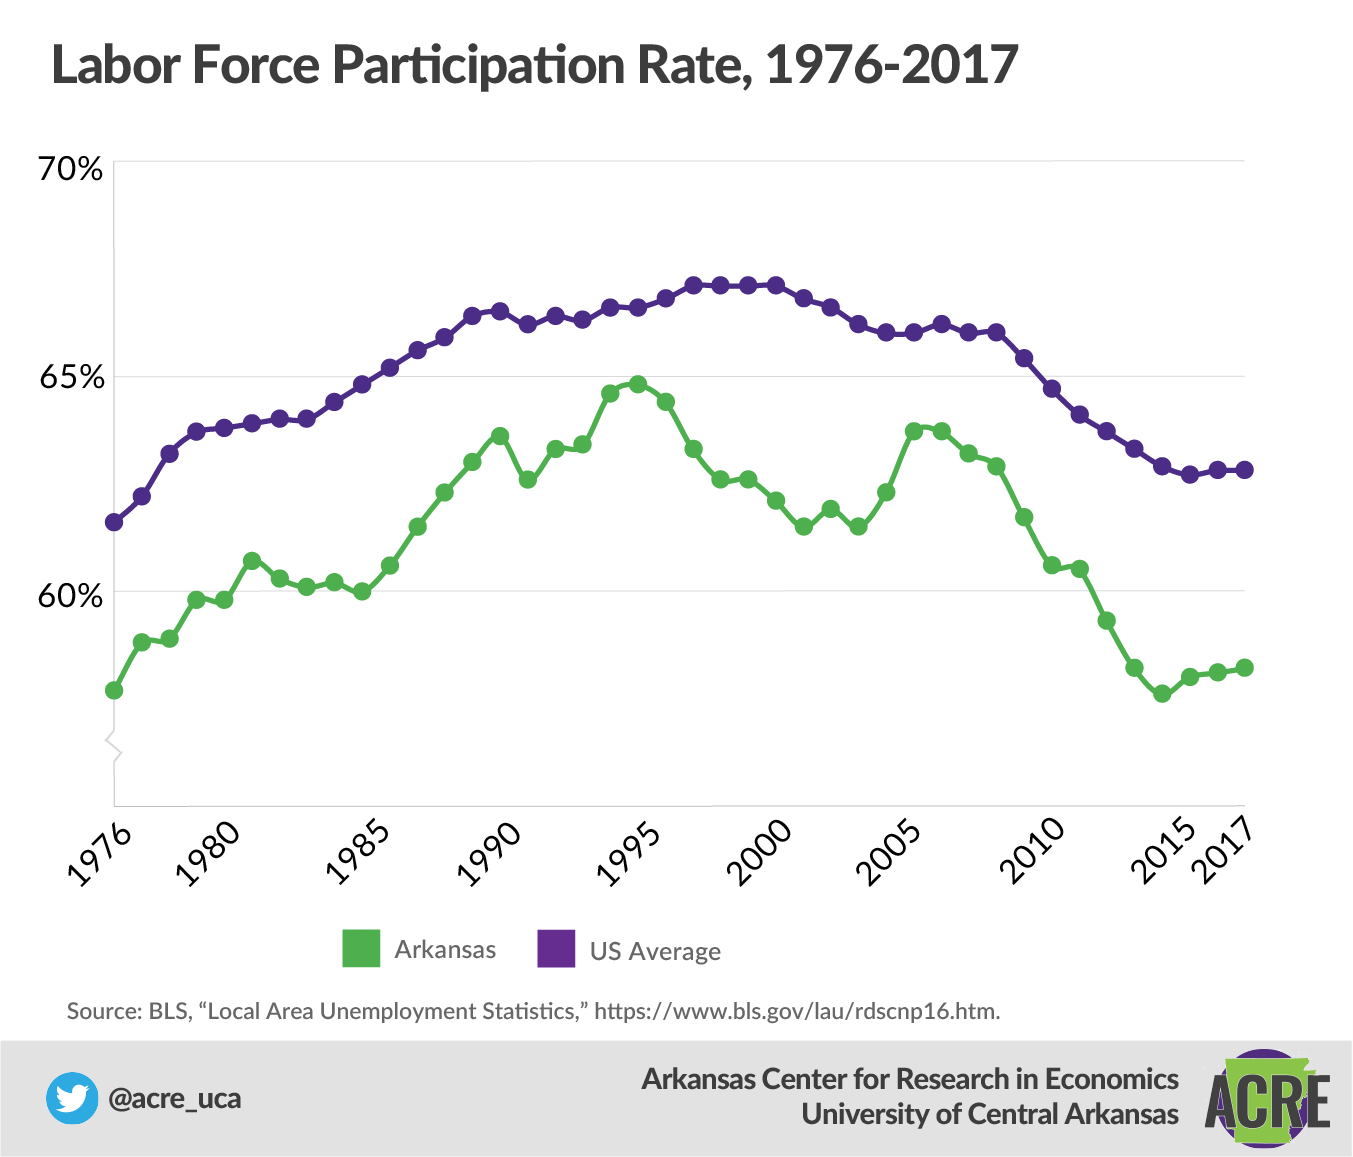
Arkansas’s unemployment rate is currently at its lowest level since the BLS began publishing this data series in 1976. A low unemployment rate is good news, and a sign that most individuals looking for a job are able to find one. However, when we look at the labor force participation rate, we see that for the past several years it has been at about 58%. The only time the labor force participation rate was lower was 1976, when it was slightly below 58%. Arkansas’s labor force participation rate has always been below the national rate. For the past few years, it has been almost 5 percentage points lower; the gap between Arkansas’s rate and the national rate is as large as it’s ever been. Putting these two statistics together, we have a more complete picture of the Arkansas labor force: compared with the US as a whole, a smaller share of Arkansans are actively in the labor force, but of those in the labor force we are performing better than the national average at finding them a job.
During the most recent recession, Arkansas’s annual unemployment rate only went as high as 8.3%, which was well below the national peak of 9.6%. Since then, Arkansas’s unemployment rate has continued to fall and is currently below the national average. But the labor force participation rate has also fallen dramatically since the recent recession, by about 4.7 percentage points. Partially this is due to changing demographics (more retirees as a percentage of the labor force) and national trends, but the national labor force participation rate has only fallen by 3.2 percentage points over the same time period. While we can attribute Arkansas’s lower labor force participation rate over the entire time period to cultural differences (such as more families with a stay at-home spouse), the fall in recent years could be a sign of a weaker labor market.
What are unemployment rates for counties in Arkansas?
As of February 2018, the counties with the lowest unemployment rate were Washington (2.8%), Benton (3.2%), Grant (3.4%), and Madison (3.4%), according to the BLS. The counties with the highest unemployment rate were Chicot (9.0%), Phillips (7.8%), and Jackson (7.0%).19 The county rates are not seasonally adjusted, and are thus not comparable to the statewide and national unemployment figures.
Footnotes:
1 BLS, “Labor Force,” Labor Force Characteristics, last updated March 26, 2018, https://www.bls.gov/cps/lfcharacteristics.htm#laborforce.
2 OECD, “Institutional Population,” Glossary of Statistical Terms, https://stats.oecd.org/glossary/detail.asp?ID=1375.
3 Investopedia, “Civilian Labor Force,” http://www.investopedia.com/terms/c/civilian-labor-force.asp, accessed October 10, 2017.
4 Washington Post, “Jobs Report Shows Effects of the Incredible Shrinking US Labor Force,” May 4, 2012, https://www.washingtonpost.com/business/economy/jobs-report-shows-effects-of-the-incredible-shrinking-us-laborforce/2012/05/04/gIQAQdBF2T_story.html?utm_term=.dca9bbfe4e02.
5 BLS, “Labor force.
6 BLS, “Unemployment,” Labor Force Characteristics, last updated March 26,2018, https://www.bls.gov/cps/lfcharacteristics.htm#unemp.
7 Ibid.
8 BLS, “How the Government Measures Unemployment,” last updated October 8, 2015, https://www.bls.gov/cps/cps_htgm.htm.
9 Ibid.
10 BLS, “Civilian Noninstitutional Population and Associated Rate and Ratio Measures for Model-Based Areas,” last updated March 12, 2018, https://www.bls.gov/lau/rdscnp16.htm.
11 BLS, “Discouraged Worker,” Labor Force Characteristics, last modified March 26, 2018, https://www.bls.gov/cps/lfcharacteristics.htm#discouraged.
12 BLS, “Not in the Labor Force,” Labor Force Characteristics, last modified March 26, 2018, https://www.bls.gov/cps/lfcharacteristics.htm#nlf.
13 BLS, “Alternative Measures of Labor Underutilization for States, 2017 Annual Averages,” https://www.bls.gov/lau/stalt.htm.
14 Michael Pakko, “Labor Force Participation,” May 22, 2012, https://www.arkansaseconomist.com/?p=3231.
15 Ibid.
16 Washington Post, “Jobs Report.”
17 BLS, “An Analysis of Long-Term Unemployment,” July 2016, https://www.bls.gov/opub/mlr/2016/article/an-analysis-of-long-term-unemployment.htm.
18 BLS, “Labor Force Statistics from the Current Population Survey,” last modified October 8, 2015, https://www.bls.gov/cps/faq.htm.
19 Arkansas Department of Workforce Services, “Arkansas Labor Force by County,” February 2018, not seasonally adjusted; preliminary estimates, http://www.discover.arkansas.gov/Employment/Labor-Force-by-County.
There are 12 main chapters in the book, each detailing and explaining and important part of the Arkansas economy. They are Median Household Income; Fortune 500 Companies; Economic Freedom; Personal Income; Wages; Poverty; Migration; Education Attainment; Government Revenue and Spending; Total Nonfarm Payroll Employment; Gross Domestic Product; Unemployment and Labor Force Participation
These 12 chapters were written by expert authors, including: Jeremy Horpedahl, an ACRE scholar and assistant professor of economics at the University of Central Arkansas; Amy Fontinelle, author and editor of hundreds of public policy works; and Greg Kaza, Executive Director of the Arkansas Policy Foundation.
If you are interested in sharing your thoughts and questions about Arkansas’s economy, we would love to hear from you. You can email ACRE at acre@uca.edu, tweet Dr. Jeremy Horpedahl, at @jmhorp, or comment on ACRE’s Facebook page.
If you would like a printed copy for your own home or office, please email acre@uca.edu with the subject line Printed Citizen’s Guide, and include your name, your organization’s name, and your address.