This section, along with the other 11 chapters on the most important parts of the Arkansas economy, are authored by Jeremy Horpedahl, an ACRE scholar and assistant professor of economics at the University of Central Arkansas; Amy Fontinelle, author and editor of hundreds of public policy works; and Greg Kaza, Executive Director of the Arkansas Policy Foundation.
This section is a chapter in a larger work – The Citizen’s Guide to Understanding Arkansas Economic Data.
What is Total Nonfarm Payroll Employment in Arkansas?
Total nonfarm payroll employment is the number of paid US workers in all businesses, excluding those who work for farms, serve in the military, volunteer for nonprofit organizations, and perform unpaid work in their own household. Self-employed, unincorporated individuals are excluded as well.1
Nonfarm payroll employment is also referred to as “covered employment,” meaning employees that are covered by unemployment insurance, and this is one reason why so many categories of workers are excluded. There are separate estimates of farm employment, and in Arkansas, farm employment (including farm owners) is about 3.4% of total employment.2
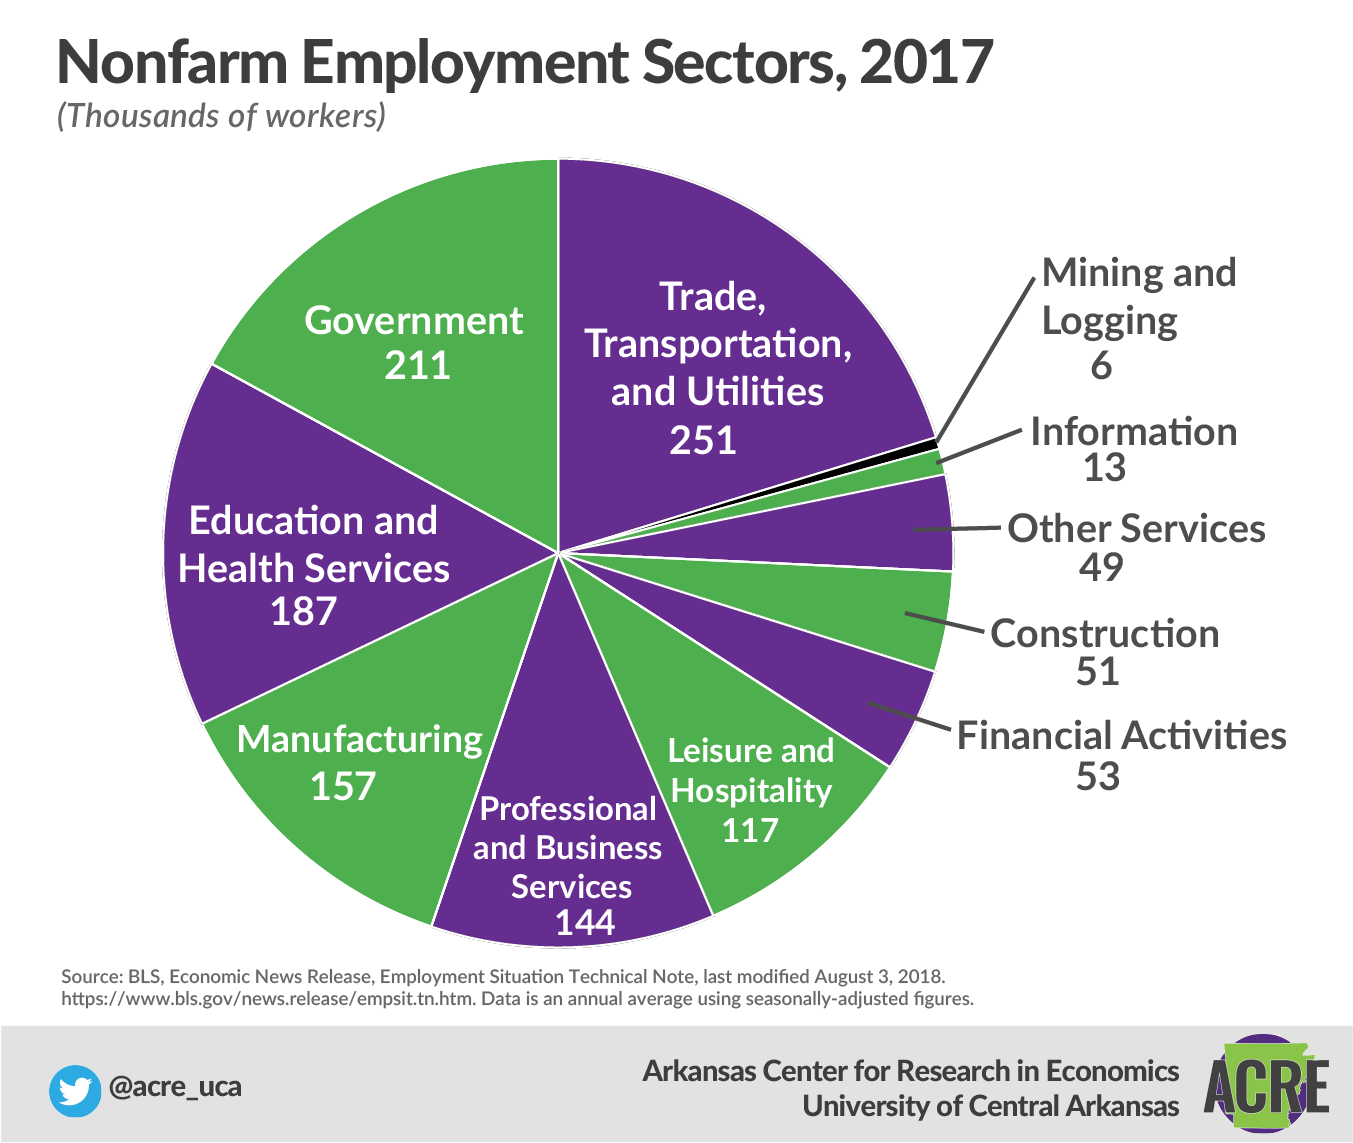
Total nonfarm payroll employment includes workers in both goods-producing and services producing sectors. The goods-producing sectors are natural resources and mining, construction,
wholesale and retail trade, and manufacturing. The services-producing sectors are trade, transportation, and utilities; warehousing; financial activities; professional and business services; education and health services; leisure and hospitality; other services; and government.
The Employment Situation report from the Bureau of Labor Statistics (BLS) contains data from two government-conducted surveys: an establishment survey of about 149,000 businesses
and government agencies representing about one-third of all nonfarm payroll employees, and a household survey of about 60,000 households.3 The larger establishment survey of businesses generates the data in this section.
State labor market agencies such as the Arkansas Department of Workforce Services,4 along with the federal BLS,5 survey the job market monthly and compile federal and state data for the previous month. On the first Friday of each month, the bureau reports the change in the numbers from the previous month. The Employment Situation report also includes information about the average workweek, average hourly earnings, and wage growth.6 It is important because it is timely, covers most of the US economy, and has a large sample size. The report’s release tends to affect the US stock market, the value of the dollar, and other financial markets as traders react to the news.
Why is Total Nonfarm Payroll Employment important to Arkansans?
Job creation is one of the broadest state-level economic indicators, along with gross domestic product (GDP). When employment is increasing, more people are gaining an income, which results in greater spending. When it’s decreasing, more people are losing their incomes, resulting in lower spending. Total nonfarm payroll employment data help economists analyze labor-market and economic conditions.
Looking at these data, along with other factors, helps us know if we are in an economic expansion or an economic contraction (recession).7 However, in recent recessions, employment has been a lagging rather than leading indicator: it doesn’t tend to fall until after other variables, such as GDP, have already been declining for months. Employment also doesn’t recover as quickly as the broader economy. Still, nonfarm payroll employment data are important as one of the 10 variables officials look at to decide whether the economy is expanding or contracting and to adjust government policy accordingly.
For example, total nonfarm payroll employment is one indicator of how well the economy is doing and how the Federal Reserve might change its interest rate target to increase employment or curb inflation. When employment is faltering, lowering the target interest rate can help. Individuals and businesses can then borrow at a lower cost. When employment numbers are robust, inflation can result, so the Fed might decide to increase interest rates to slow borrowing and spending.
Also, knowing which sectors are expanding or contracting can tell us which closely related sectors might expand or contract in the near future. The nonfarm payroll report is not a leading indicator for the labor market, but it is a coincident indicator for the overall economy. For example, as firms’ labor costs go up, prices can go up.
The total nonfarm payroll employment report also tells us how many jobs were created or lost in specific industries. We can compare Arkansas’s employment numbers to those of other states and the United States as a whole to see how well the state and specific industries are performing. Then we can evaluate which policies might be helping or harming Arkansas residents who want to work.
The report also breaks down job gains and losses by metropolitan statistical area.8 This information helps us to see how people in different parts of Arkansas are faring.
Why are so many types of workers excluded from nonfarm payroll data?
The nonfarm payroll report primarily covers employment that may fluctuate with the overall economy. Military employment changes primarily based on the need for national defense, not the performance of the economy. Self-employed individuals don’t usually lose their jobs during a recession, though their income may certainly decline. Agricultural employment tends to have its own business cycle that is not correlated with the broader economy. So even though only about 80% of the workforce is covered by the survey, it represents most of the workforce that tends to fluctuate throughout the ups and downs of the business cycle.
Why does the government make seasonal adjustments and revisions to the data after they are first published?
Seasonal adjustments make it easier to judge whether an employment change is due to normal annual changes or is an indicator that the economy is moving into or out of a recession. For example, retail stores tend to hire a lot of temporary additional workers during November and December, but these jobs are usually eliminated by January. This is a regular annual fluctuation, which you can see in the “not seasonally adjusted” series of the data, but we don’t want to be fooled into thinking the economy is falling into a recession every January.
Economists revise the numbers when more complete data become available. The payroll survey is just that: a survey of a sample of employers. The sample can give us good, real-time information on the economy, but the sample is not always completely representative of the economy. There is also a data series called the Quarterly Census of Employment and Wages, which is a complete data set of workers (at least, those covered by unemployment insurance), but it isn’t available as frequently as the Establishment Survey. Furthermore, the Census Bureau conducts a survey of all businesses in the United States once every five years, which also can be used to supplement gaps in the survey data.
Why are there two surveys?
Why do we even use the household survey if the establishment survey is more reliable? The establishment survey’s sample size is about seven times larger than the household survey’s, so it is considered more reliable. It is also based on firms’ actual payroll numbers rather than how individuals respond to a survey (questions can be confusing and yield inaccurate responses, despite attempts to make the survey user-friendly).
But the establishment survey of employers can only tell you how many people are employed. It can’t, by definition, tell you how many people aren’t working, or how many people are in school, or how many have given up looking for work. The numbers produced by each survey can paint a conflicting picture, due to sampling different parts of the economy. With both surveys, we get up-to-the-minute data, but when they conflict, it might mean we should reserve judgment until more complete data are available.
What is the trend in Arkansas’s total nonfarm payroll employment?
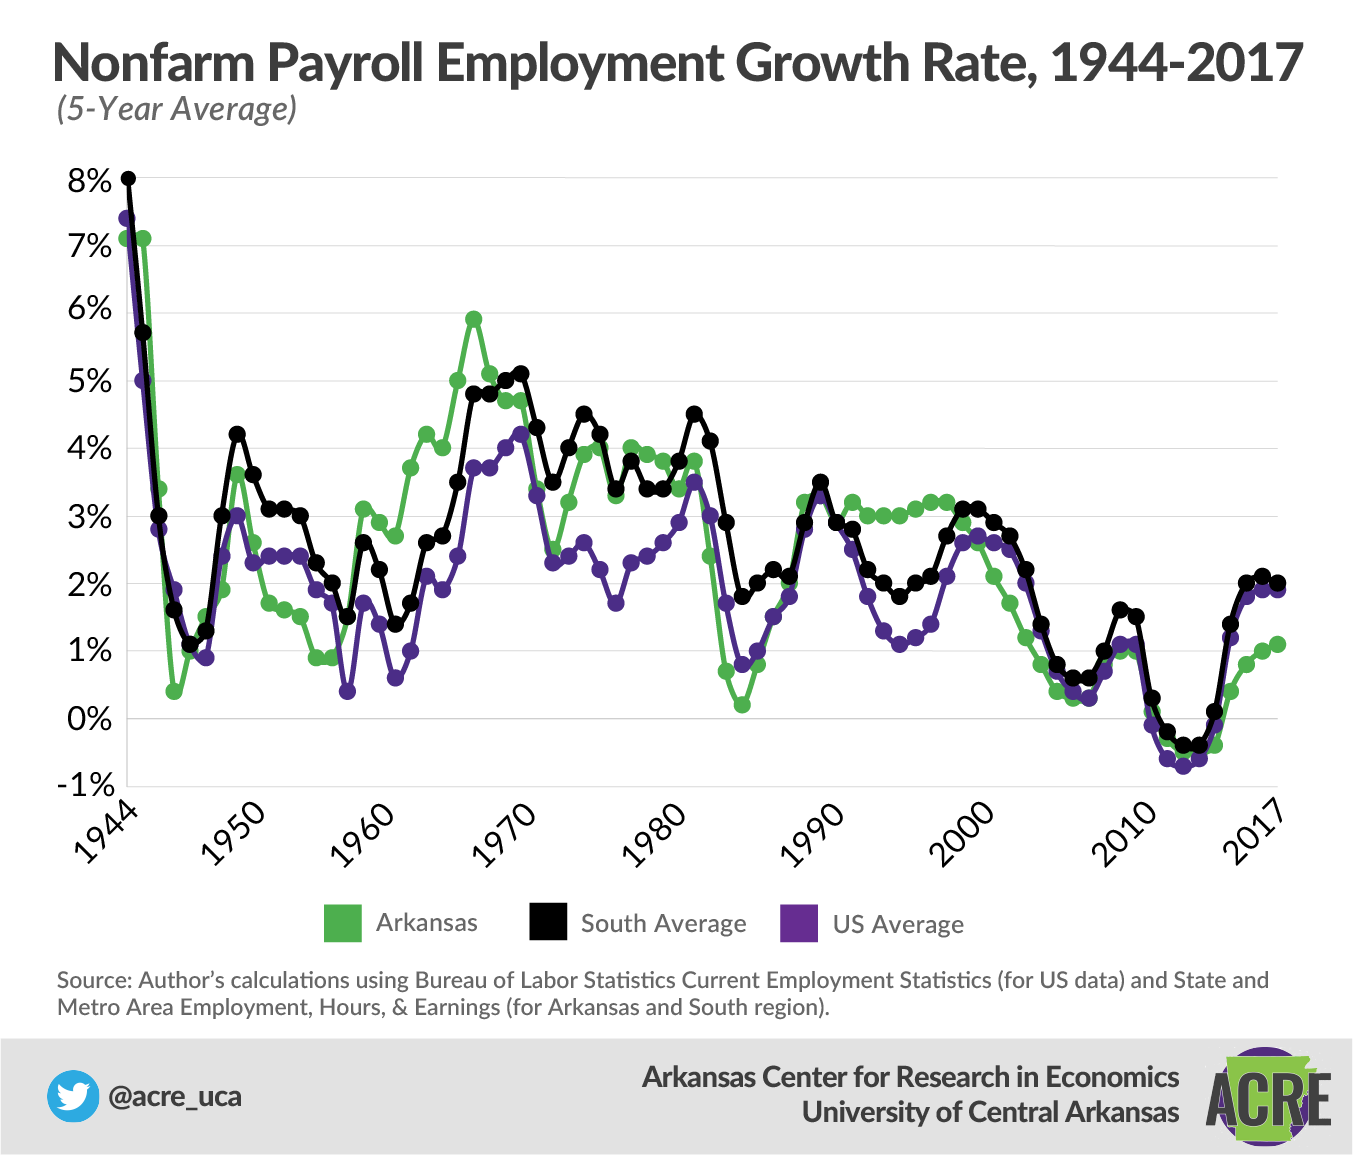
Since the end of the Great Recession, Arkansas has seen job growth every year from 2010 to the present. However, it took until August of 2015 for the nonfarm employment number to surpass the previous peak achieved in February 2008 (both at about 1.2 million jobs, seasonally adjusted).
From January 2010, the low point of employment after the Great Recession, to January 2018, Arkansas added about 88,000 jobs—a growth rate of about 7.8% (these data are not seasonally adjusted, since we are comparing January of one year with January of another year). However, over this same period from 2010 to 2018, total employment across the country grew at a rate of 13.8%, much faster than Arkansas. If we just look at a recent period, such as May 2017 to May 2018, Arkansas nonfarm jobs grew by 0.7%, and nationally, jobs grew by 1.6%—over twice as fast as Arkansas. Arkansas also had the slowest growth among its neighbors over the past year.
Footnotes:
1 See the definition of “Payroll employment (Current Employment Statistics)” at https://www.bls.gov/bls/glossary.htm#P.
2 To locate the regional data cited here, go to Bureau of Economic Analysis, https://www.bea.gov/iTable/iTableHTML.cfm?reqid=70&step=1&isuri=1&acrdn=6, then select “Total Full-Time and Part-Time Employment by Industry (SA25, SA25N),” then select “NAICS (1998 and forward),” “Arkansas,” and “2016” to see that farm employment is 54,847 out of 1,632,609 total employment
3 BLS, Economic News Release, Employment Situation Technical Note, last modified August 3, 2018, https://www.bls.gov/news.release/empsit.tn.htm.
4 Arkansas Department of Workforce Services, dws.arkansas.gov
5 US Bureau of Labor Statistics, Current Employment Statistics, https://www.bls.gov/ces/.
6 See, for example, BLS, Economic News Release, Employment Situation Summary, August 3, 2018, https://www.bls.gov/news.release/empsit.nr0.htm
7 Federal Reserve Bank of San Francisco, “Why Does the Federal Reserve Consider Nonfarm Payroll Employment to Be an Important Economic Indicator?,” June 2004, http://www.frbsf.org/education/publications/doctorecon/2004/june/nonfarm-jobs-payroll-employment/.
8 Arkansas Department of Workforce Services, “Arkansas Labor Market: May 2015,” http://www.discover.arkansas.gov/Portals/136/Publications/Arkansas%20Labor%20Market/2015/LM_May_2015.pdf, 4–5.
There are 12 main chapters in the book, each detailing and explaining and important part of the Arkansas economy. They are Median Household Income; Fortune 500 Companies; Economic Freedom; Personal Income; Wages; Poverty; Migration; Education Attainment; Government Revenue and Spending; Total Nonfarm Payroll Employment; Gross Domestic Product; Unemployment and Labor Force Participation
These 12 chapters were written by expert authors, including: Jeremy Horpedahl, an ACRE scholar and assistant professor of economics at the University of Central Arkansas; Amy Fontinelle, author and editor of hundreds of public policy works; and Greg Kaza, Executive Director of the Arkansas Policy Foundation.
If you are interested in sharing your thoughts and questions about Arkansas’s economy, we would love to hear from you. You can email ACRE at acre@uca.edu, tweet Dr. Jeremy Horpedahl, at @jmhorp, or comment on ACRE’s Facebook page.
If you would like a printed copy for your own home or office, please email acre@uca.edu with the subject line Printed Citizen’s Guide, and include your name, your organization’s name, and your address.