This section, along with the other 11 chapters on the most important parts of the Arkansas economy, are authored by Jeremy Horpedahl, an ACRE scholar and assistant professor of economics at the University of Central Arkansas; Amy Fontinelle, author and editor of hundreds of public policy works; and Greg Kaza, Executive Director of the Arkansas Policy Foundation.
This section is a chapter in a larger work – The Citizen’s Guide to Understanding Arkansas Economic Data.
What is the poverty rate in Arkansas?
The poverty rate tells us what percentage of a geopolitical area’s residents earn an income below certain thresholds. The US Census Bureau produces the official federal poverty statistics from responses to its Current Population Survey (CPS), a monthly survey of about 60,000 US households.1
The American Community Survey (ACS) is the best measure of subnational poverty rates because it has a larger sample size than the CPS. The ACS surveys about 3 million addresses per year and its results help to decide how federal and state funds are allocated.2 The two surveys use different inputs, so their data should not be directly compared.3 This section of our guide primarily relies on ACS data.
The most recent poverty rate for Arkansas is 17.2% for 2016, meaning that Arkansas has the nation’s seventh highest poverty rate. The official US poverty rate is 14.0%.4 For the United States as a whole, poverty rates decreased in every group from 2015 to 2016 except for adults 65 and older.5
The poverty rate, along with many other economic indicators, gives Arkansas policymakers a gauge to see if they are helping the poorest citizens and families. It’s good for the state’s median household income to increase, but if the poverty rate is not falling at the same time, we might be worried and ask why.
How is the poverty threshold determined?
The Census Bureau sets a poverty threshold each year based on household composition and the age of a household’s members. The poverty thresholds were developed in the 1960s and were initially based on an annual cash income deemed sufficient to meet basic needs. Basic needs were defined for most families as three times the cost of a standard food budget (as determined by the Department of Agriculture). Since 1969, the food-based thresholds have been adjusted for changes in the cost of living as measured by the Consumer Price Index and are no longer tied to the cost of food or of any specific necessities.
Any household whose income falls below the poverty level is considered poor, and all members of the household are counted as being in poverty. Income is defined as pretax income and cash welfare assistance. It does not include benefits from the Supplemental Nutrition Assistance Program (SNAP) or Medicaid, nor does it account for any taxes the family pays (but see the alternative Supplemental Poverty Measure, discussed later in this section, for important differences with respect to these factors).6
There are separate poverty thresholds for those over the age of 65, as well as for Alaska and Hawaii, but the other 48 states have the same poverty thresholds despite their varying costs of living. And it’s important to note that this measurement of poverty is binary: either you are in poverty, or you are not. Earn one dollar above the threshold and you are not classified as being in poverty.
How are poverty thresholds used?
One major function of the poverty thresholds is to determine eligibility for a variety of federal programs. These range from Health and Human Services programs such as Head Start, the Children’s Health Insurance Program, and various parts of Medicaid and Medicare, to food programs such as SNAP (formerly food stamps) and the Special Supplemental Nutrition Program for Women, Infants, and Children (WIC), to the Weatherization Assistance Program, Job Corps, and Legal Services for the Poor (and many others).7
Some of these programs use percentage multiples of the poverty thresholds (such as 150% or 200%), and not all use these numbers as a hard cutoff: some use the thresholds as a target for phaseouts. For example, the Affordable Care Act provides subsidies for purchasing health insurance on the marketplace exchanges up to 400% of the poverty thresholds, but the subsidies get smaller as one approaches 400%, at which point they become zero.
What are the poverty thresholds?
In 2017, the national poverty threshold for a household of one person under age 65 was $12,752. If that person was 65 or older, the poverty threshold was about $1,000 lower, at $11,756.8
For two individuals in a household, you might think you would just double the one-person number, but that’s not how poverty thresholds work. Instead, the figure for a two-person household is $16,414 if both are adults, or $16,895 if one is under 18. It is $14,816 if one or more of the adults are 65 or older.9
The logic for not doubling the threshold amount is that while preparing food for two is more expensive than preparing food for one, it is not twice as expensive. In other words, there are cost savings for buying and cooking more food at once. For instance, buying a five-pound sack of potatoes might cost the same as buying two pounds of loose potatoes. And cooking five pounds of potatoes would take more electricity, but not twice as much, as cooking two pounds of potatoes. Similar efficiencies exist for other household expenses. For example, a two-bedroom apartment is more expensive than a one bedroom, but not twice as expensive. For each additional household member, the poverty threshold increases, though not by a constant amount (usually somewhere between $3,000 and $6,000 per household member). Once a household grows beyond nine members, the poverty threshold does not increase any further.
How does Arkansas’s poverty rate compare to surrounding states?
While Arkansas does have a high poverty rate, it is not out of line with many of our neighboring states. Arkansas’s poverty rate of 17.2%, the seventh highest in the nation, is better than Louisiana’s or Mississippi’s. They have the highest poverty rates in the nation at 20.2% and 20.8% as of 2016. Oklahoma, Tennessee, and Texas are just below Arkansas with the 10th, 12th, and 13th highest rates (16.3%, 15.8%, and 15.6%). Missouri fares quite a bit better, right at the national poverty rate of 14%, ranked 23rd highest.
The fact that Arkansas’s rate is close to its neighbors is cold comfort to those who live in poverty, however. We should not use this comparison as an excuse to say that everything is okay, but merely as an acknowledgement of reality and a starting point for improvement.
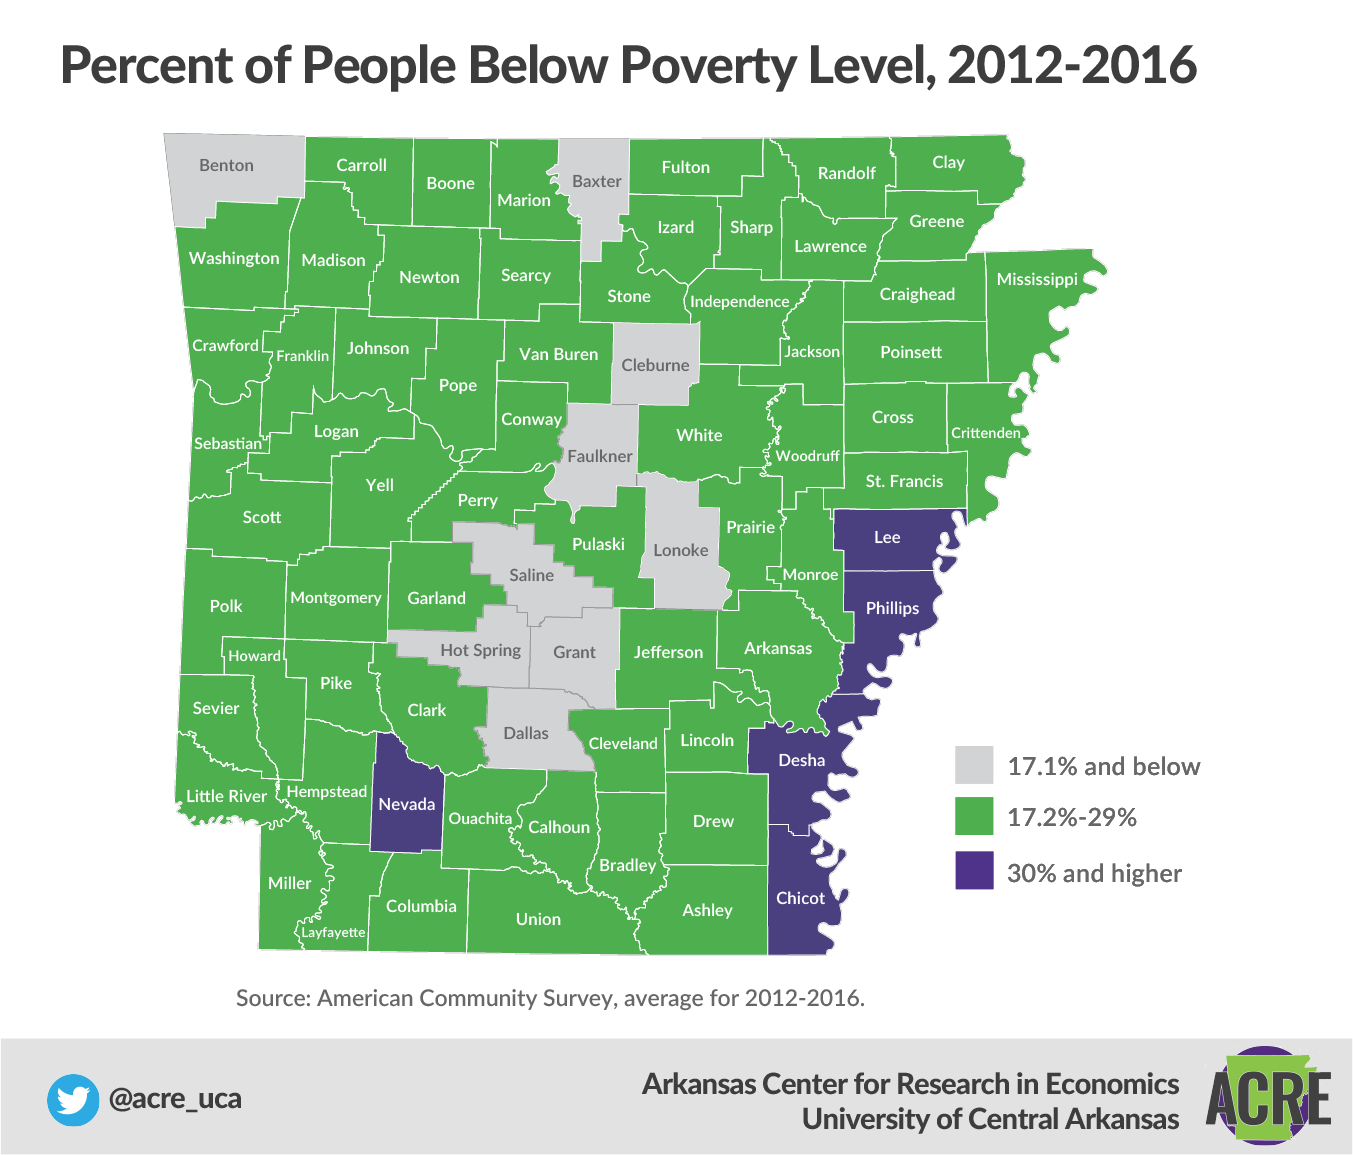
Arkansas’s poverty rates vary considerably by county. The counties with the highest poverty rates are Phillips, Desha, Chicot, Nevada, and Lee, which all had poverty rates above 30% in 2016. The counties with the lowest poverty rates are Saline, Benton, Lonoke, Grant, and Baxter, which all had poverty rates under 14%.10
US poverty rates do not adjust for the cost of living in different areas. As such, the poverty rate may be overstated in areas with lower living costs and understated in areas with higher living costs.11
Are there other ways to measure poverty?
Yes. In 2009, the Census Bureau introduced a new Supplemental Poverty Measure to account for shortcomings in the official poverty rate. This new measure is not intended to be used for determining qualifications for antipoverty programs, primarily because it includes the value of many antipoverty programs in its calculations. Instead, it is designed to give a different perspective on poverty, to show the effects of both taxes and government transfer programs on the well-being of individuals and families.12
In addition to adding in the value of government programs and subtracting taxes from an individual’s income, the Supplemental Poverty Measure (SPM) is different in a few other ways. First, the poverty thresholds are not set by the cost of buying food in the 1960s. Instead, they are based on the cost of buying food, clothing, shelter, and utilities, updated on a fiveyear moving average basis.13 Second, the thresholds vary based on the cost of housing in different locations, a recognition of the varying cost of living across the country that the official poverty measure neglects. The SPM also subtracts some expenses, such as medical expenses, that are not really discretionary.
These changes can either increase or decrease state poverty rates as measured by the SPM compared to the official rate. And they do: in 13 states, the supplemental rate is higher; in 20 states (including Arkansas), it is lower; and in the remaining 17 states, it is about the same (not statistically different). Arkansas’s Supplemental Poverty Rate is about 2 percentage points lower than its official poverty rate. Arkansas also improves from being the ninth poorest state to the 15th poorest.14
In other words, the cost of living is lower in Arkansas than the national average, but not low enough that the poverty rank changes dramatically. Some states do see large changes, though: California, Florida, New York, New Jersey, Virginia, Hawaii, Maryland, and Connecticut all move up at least 10 spots (indicating higher poverty by this new measure), while Idaho, Kansas, South Dakota, Maine, Ohio, Oklahoma, and West Virginia all move down 10 spots or more (indicating lower poverty by this new measure). For the nation as a whole, about 3 million more people are counted as being in poverty under the supplemental measure.
How does Arkansas’s poverty rate vary by age?
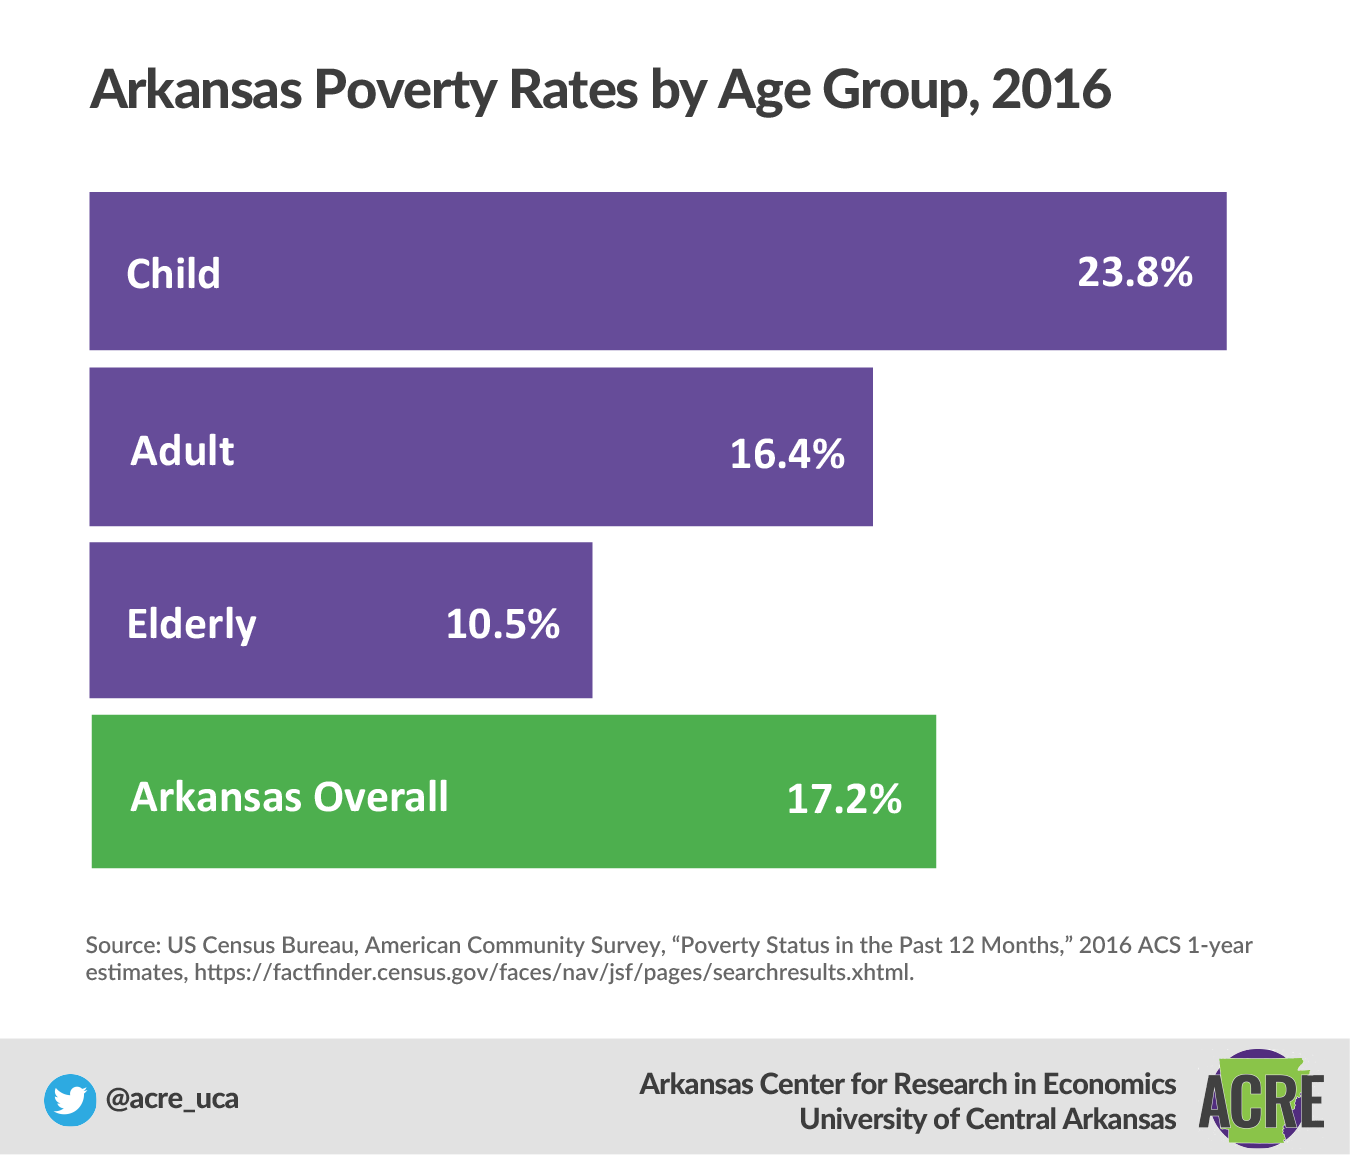
The child poverty rate tells us the percentage of children under 18 living in families below the poverty line. In Arkansas and across the country, child poverty rates are generally higher than overall poverty rates. If a family is below the poverty line, all family members are considered to be in poverty, and poor families have, on average, more children. In 2016, Arkansas had a child poverty rate of 23.8%, much higher than the state’s overall rate of 17.2%. That means Arkansas has the eighth highest child poverty rate among the 50 states and Washington, DC. On the bright side, Arkansas’s child poverty rate did decrease by 3.4% from 2015, when it was 27.2%.15
The poverty rate for those 65 years and older is lower than the overall poverty rate in Arkansas. It was 10.5% in 2016,16 lower than the overall rate of 17.2%. The elderly poverty rate is lower than the overall poverty rate for the United States as well. The elderly have lower poverty rates because of retirement income such as Social Security and pension payments.
Which demographic groups in Arkansas have the highest and lowest poverty rates?
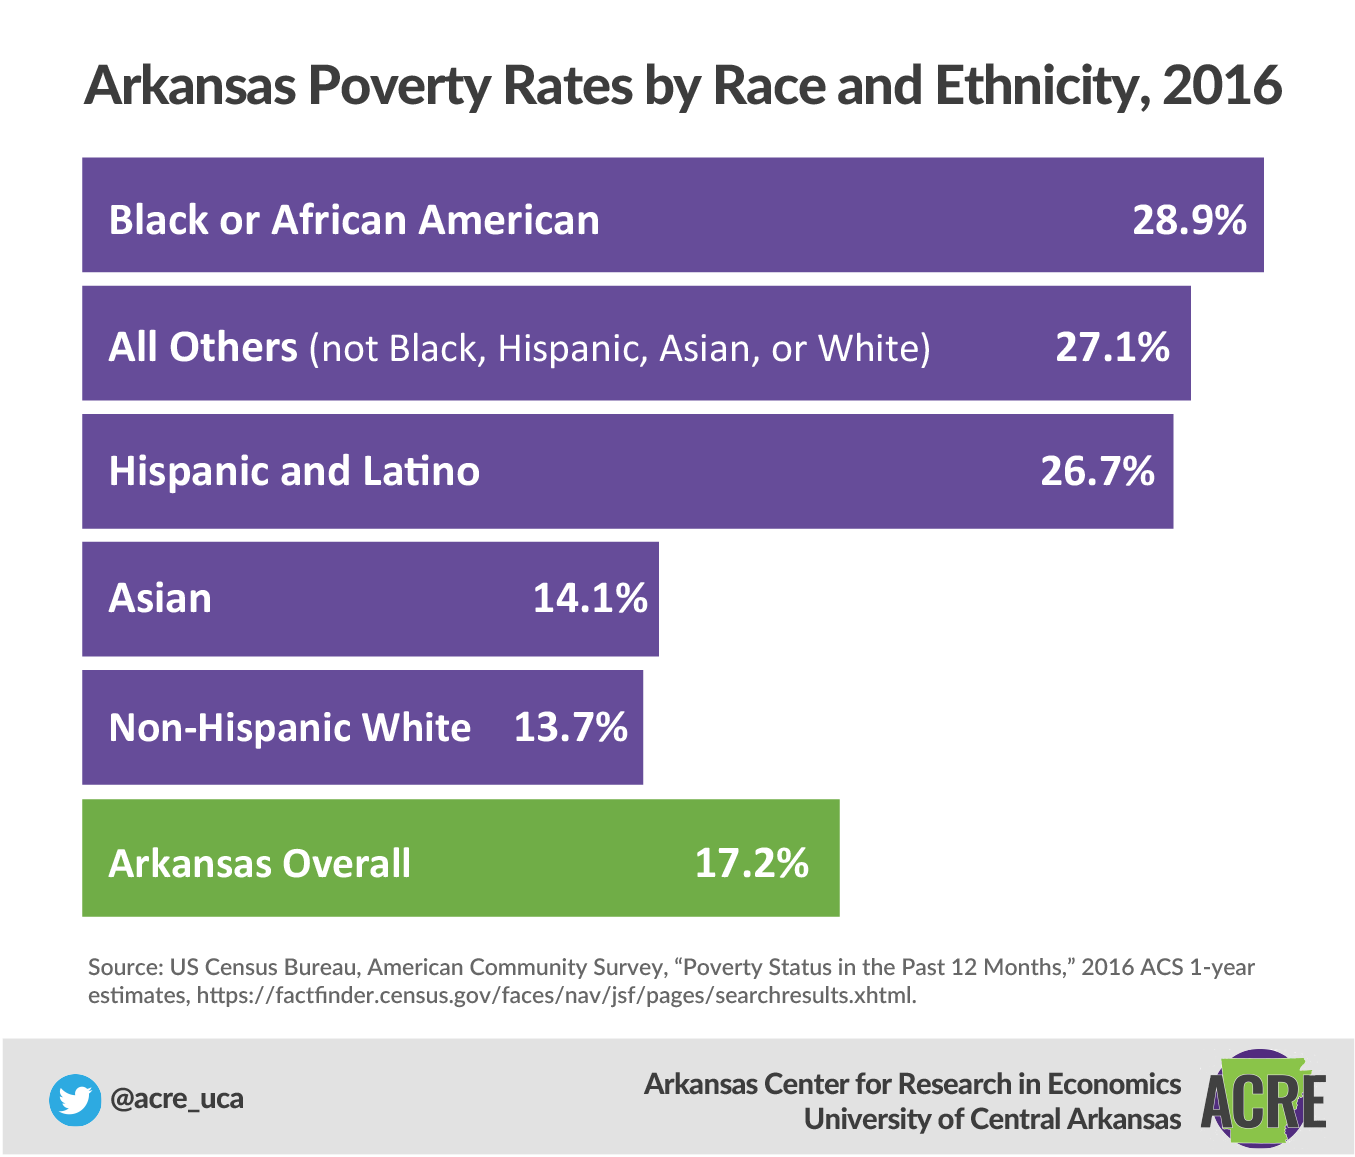
Grouping families by race and ethnicity, we see large differences in poverty rates in Arkansas. Arkansans categorized by the census as black or African American have the highest poverty rate at 28.9%. Non-Hispanic white Arkansans have the lowest poverty rate at 13.7%. But note that, because there are more white than black Arkansans (about 290,000 as compared to 127,000), the majority of Arkansans living in poverty are white. Hispanics and Latinos have a poverty rate similar to African Americans at 26.7%, or about 56,000 individuals.17
Looking at educational groups, it is not surprising that as educational attainment increases, the poverty rate falls, but the difference is dramatic. High school dropouts have a poverty rate of 27.2%, and those with a four-year college degree or higher have a rate of 4.5%. Even going to the next category, some college and associate’s degrees, the poverty rate of 11.8% is over 2.5 times higher than that of four-year college graduates.18
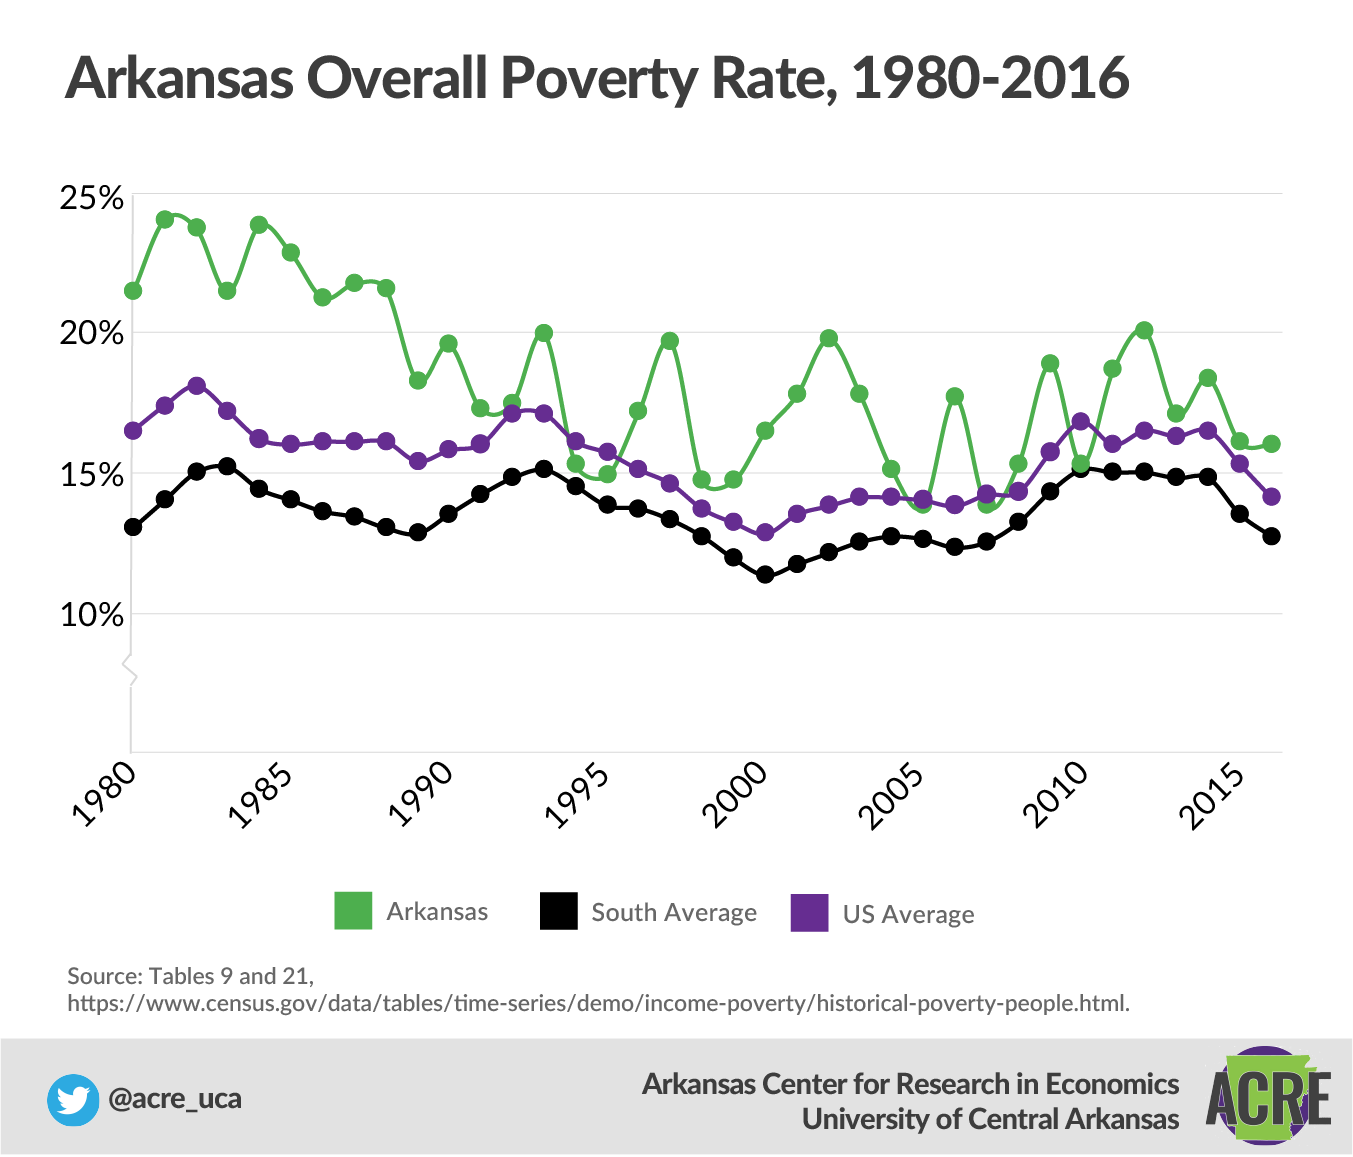
What are the trends in Arkansas’s poverty rate?
Since 1980, Arkansas’s poverty rate has fluctuated from a high of 24.1% in 1981 to a low of 13.8% in both 2005 and 2007.19 The poverty rate in Arkansas, like most of the nation, tends to change with the business cycle: it goes up in and around recessions, and declines when the economy improves. As the state’s economy has improved in recent years and the unemployment rate has gone down, Arkansas has seen large declines in poverty rates.20
Footnotes:
1 US Department of Labor, Bureau of Labor Statistics, “The Employment Situation: June 2018,” news release, https://stats.bls.gov/news.release/pdf/ empsit.pdf, 9.
2 Institute for Research on Poverty, “How Is Poverty Measured in the United States?” last updated May 9, 2011, https://www.ssc.wisc.edu/irpweb/faqs/faq2.htm.
3 US Department of Agriculture (USDA), Economic Research Service, “Rural Poverty & Well-Being,” A Note about Data Sources, https://www.ers.usda.gov/topics/rural-economy-population/rural-poverty-well-being/#note, accessed January 3, 2019.
4 American Community Survey, 2016, https://factfinder.census.gov/bkmk/navigation/1.0/en/d_program%3AACS/d_dataset%3AACS_16_1YR/d_product_type%3ADATA_PROFILE/. Recall that the ACS measure differs slightly from the CPS measure.
5 US Census Bureau, Income and Poverty in the United States: 2016, https://www.census.gov/library/publications/2017/demo/p60-259.html.
6 Ibid.
7 US Department of Health and Human Services, What Programs Use the PovertyGuidelines?, last updated January 20, 2012, https://www.hhs.gov/answers/hhsadministrative/what-programs-use-the-poverty-guidelines/index.html.
8 The poverty threshold is lower for the elderly because they spend less on food, which was the determining factor when the poverty thresholds were established.
9 US Census Bureau, Poverty Thresholds, https://www.census.gov/data/tables/time-series/demo/income-poverty/historical-poverty-thresholds.html, accessed January 3, 2019.
10 American Community Survey, average for 2012–16. County poverty rates use five-year averages since the sample size is so small.
11 USDA, Economic Research Service, “Rural Poverty & Well-Being,” A Note about Data Sources.
12 Liana Fox, The Supplemental Poverty Measure: 2016, US Census Bureau, September 2017, https://www.census.gov/content/dam/Census/library/publications/2017/demo/p60-261.pdf.
13 For example, the 2016 threshold is based on an average for the costs from 2012 through 2016.
14 This ranking differs slightly from the seventh-poorest ranking discussed above because the SPM uses CPS data, and because it is an average of 2014–16 measures, rather than just a measure for 2016 as the ACS measure is.
15 Alemayehu Bishaw, “Testing for a Rise in State Child Poverty Rates of 5% or Greater for 2015–2016,” US Census Bureau, April 2018, https://www.census.gov/data/tables/2018/demo/income-poverty/state-level-child-poverty.html.
16 US Census Bureau, American Community Survey, “Percent of People 65 Years and Over Below Poverty Level in the Past 12 Months,” 2016 ACS 1-year estimates,
https://factfinder.census.gov/faces/tableservices/jsf/pages/productview.xhtml?src=bkmk. On the role of Social Security in lowering the poverty rate see Gary V. Engelhardt and Jonathan Gruber, “Social Security and the Evolution of Elderly Poverty,” in Alan Auerbach, David Card and John Quigley (eds.) Public Policy and the Income Distribution. (New York: Russell Sage Foundation, 2006).
17 US Census Bureau, American Community Survey, “Poverty Status in the Past 12 Months,” 2016 ACS 1-year estimates, https://factfinder.census.gov/faces/nav/jsf/pages/searchresults.xhtml.
18 Ibid.
19 US Census Bureau, Historical Poverty Tables: People and Families, 1959–2016, Table 21, https://www.census.gov/data/tables/time-series/demo/incomepoverty/historical-poverty-people.html, accessed January 3, 2019.
20 Associated Press, “Poverty Rate in Arkansas Shrinks,” September 18, 2017, https://www.usnews.com/news/best-states/arkansas/articles/2017-09-18/poverty-rate-in-arkansas-shrinks.
There are 12 main chapters in the book, each detailing and explaining and important part of the Arkansas economy. They are Median Household Income; Fortune 500 Companies; Economic Freedom; Personal Income; Wages; Poverty; Migration; Education Attainment; Government Revenue and Spending; Total Nonfarm Payroll Employment; Gross Domestic Product; Unemployment and Labor Force Participation
These 12 chapters were written by expert authors, including: Jeremy Horpedahl, an ACRE scholar and assistant professor of economics at the University of Central Arkansas; Amy Fontinelle, author and editor of hundreds of public policy works; and Greg Kaza, Executive Director of the Arkansas Policy Foundation.
If you are interested in sharing your thoughts and questions about Arkansas’s economy, we would love to hear from you. You can email ACRE at acre@uca.edu, tweet Dr. Jeremy Horpedahl, at @jmhorp, or comment on ACRE’s Facebook page.
If you would like a printed copy for your own home or office, please email acre@uca.edu with the subject line Printed Citizen’s Guide, and include your name, your organization’s name, and your address.