This section, along with the other 11 chapters on the most important parts of the Arkansas economy, are authored by Jeremy Horpedahl, an ACRE scholar and assistant professor of economics at the University of Central Arkansas; Amy Fontinelle, author and editor of hundreds of public policy works; and Greg Kaza, Executive Director of the Arkansas Policy Foundation.
This section is a chapter in a larger work – The Citizen’s Guide to Understanding Arkansas Economic Data.
What is migration?
Migration describes the movement of people to and from a geopolitical entity such as a city, county, state, or country. People may migrate in search of higher pay, lower living expenses, or an improved quality of life.
One source of migration data is the Internal Revenue Service’s Statistics of Income program. This program, in collaboration with the US Census Bureau, tracks year-to-year address changes as reported on individuals’ federal tax returns. Data from 1991 through 2016 are available showing the number of people who moved to a state and where they moved from, as well as the number of people who left a state and where they went. These data are also available at the county level.1
Migrants can come from other countries or other states. In Arkansas’s case, the vast majority of migrants come from other states (at least, as far as we can determine from tax records). For example, in 2016, 61,281 individuals moved to Arkansas, but only 748 of them came from another country. Also in 2016, 60,253 individuals left Arkansas, and only 927 of them left the United States.2 While the IRS data do not tell us where the 2016 international migrants came from, the American Immigration Council says that cumulatively, about 5% of Arkansans are foreign-born immigrants, and they mainly come from Mexico, El Salvador, India, Guatemala, and China.3
Why is migration important to Arkansans?
Economic research suggests that positive net migration (meaning that more individuals move into the state than move out) benefits a state’s economy because of the skills held by relocated workers. Expanding economies rely on these workers to fill both skilled and unskilled positions. Skilled workers are needed when the local education system is not producing desirable skills in sufficient quantities. Unskilled workers often work jobs unfilled by native residents.4
Migration helps Arkansas be as economically productive as possible and increases living standards for all residents. When working people move to Arkansas or move within Arkansas to an area where their skills are in higher demand, we not only benefit directly from the fruits of their labor, but the state gains tax revenue as well. When those people shop with the dollars they’ve earned, they provide sales tax revenue. And when they buy homes, local property tax revenues increase. When state and local governments use those tax dollars wisely, the provision of public goods and services such as infrastructure and education improves.
Conversely, when working people leave Arkansas because opportunities are better elsewhere, the state loses economic productivity and tax revenue.
How does Arkansas rank on migration?
From 2015 to 2016, IRS data show that 20 states had positive net migration. Arkansas was among those states, with 1,028 more individuals moving into Arkansas than moving out.5 This figure places Arkansas 19th in terms of raw net migration numbers. While that’s near the bottom of the list of the 20 states with a net inflow, keep in mind that 30 states had a net outflow (more people leaving the state than coming there).6
Even if we examine these numbers on a population weighted basis by dividing the number of net migrants by the number of nonmigrants (those that don’t move in a given year), Arkansas’s rank doesn’t change much: it would be 20th, lowest among states with net inflows (keeping in mind again that most states had a net outflow).
How does Arkansas’s migration compare to surrounding states?
High-performing, high-wage economic sectors can attract migrants to a state even if red tape, taxes, and housing costs are relatively high.7 However, in general, states with low taxes, relatively few regulations, and low housing costs have attracted the most migrants on net in recent years.8
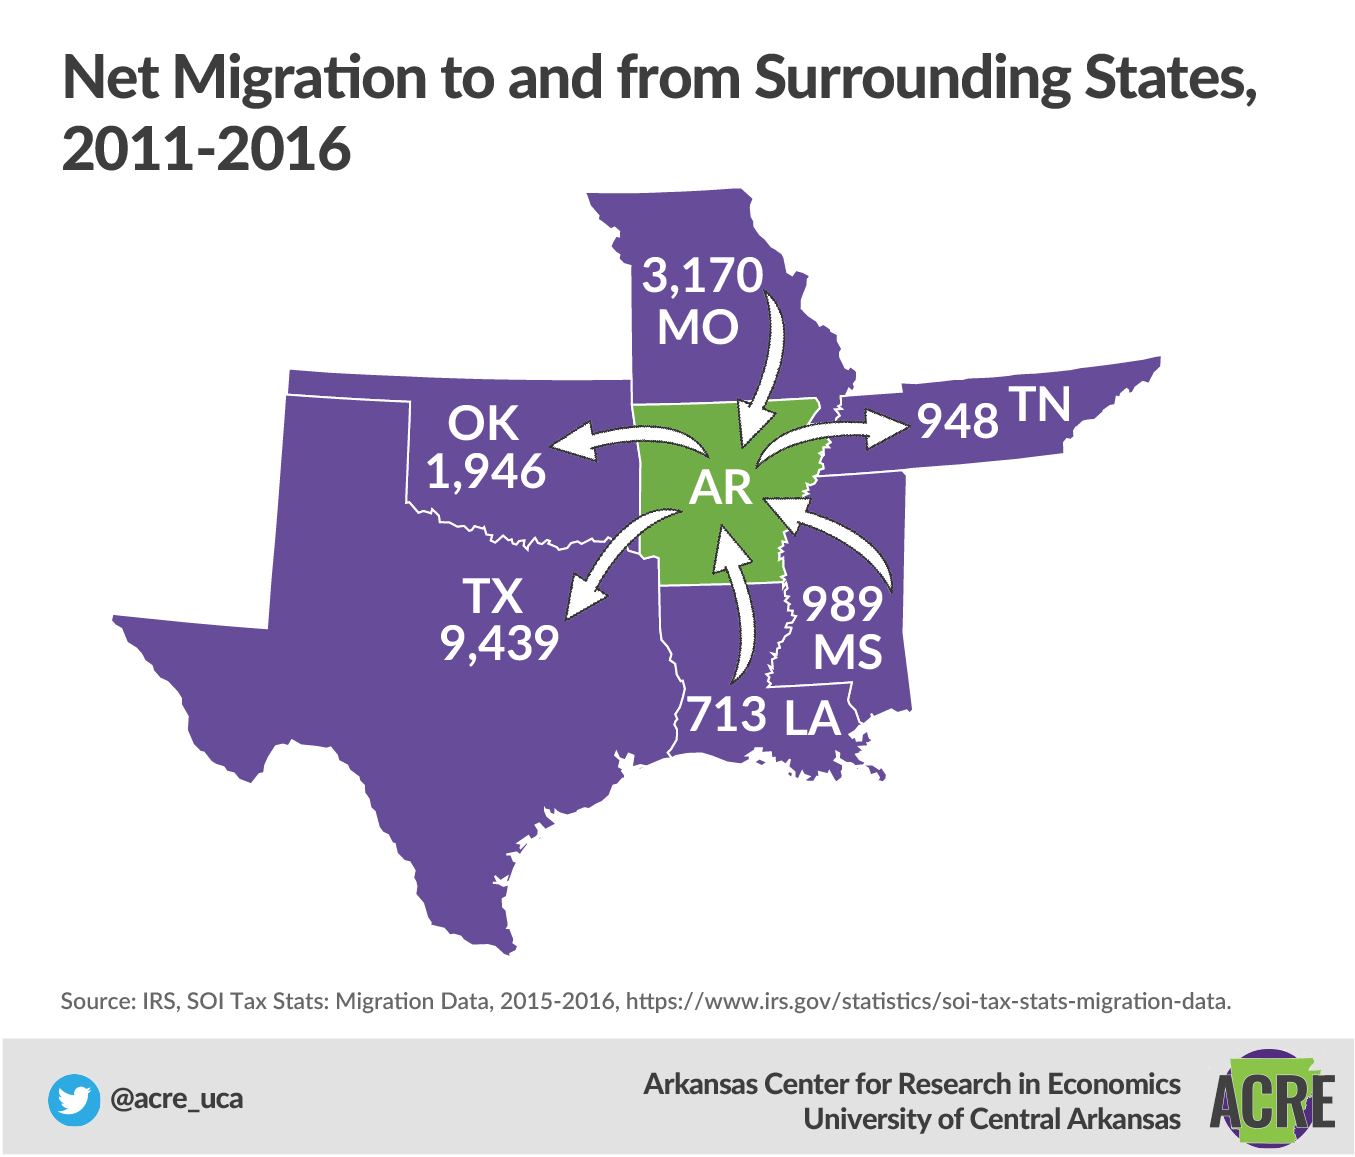
This pattern seems to hold among Arkansas’s neighboring states, with the biggest gainers of migrants being Tennessee and Texas, the two states in our region without an income tax on wages and salaries. From 2015 to 2016, Texas gained over 55,000 residents from migration, and Tennessee gained over 26,000. Recall that Arkansas also had a net gain of residents from migration, but it was only about 1,000 people. Louisiana lost the most: over 10,000 residents from 2015 to 2016. Mississippi lost about 6,000, Missouri lost about 4,800, and Oklahoma lost about 3,800. As a percentage of all residents, the migration numbers are very small: never more than 0.5% in either direction for these states. But whether a state is a net gainer or loser is still important.9
Arkansas’s migration relationship to these neighboring states fits the overall pattern described here. Looking at the period from 2011 to 2016, Arkansas tends to lose residents to Oklahoma, Tennessee, and Texas in most years and to gain migrants from Missouri, Mississippi, and Louisiana in almost every year.
Are any individuals not captured in the migration data?
Yes. Individuals not required to file tax returns are not captured in the data. Also, individuals who don’t file tax returns in consecutive years are not captured in the data.10 A major missing group is migrants who do not currently have the legal right to work in the United States, but who do so anyway. No economic measurement is perfect, but the data we have are probably good enough since most people do file tax returns.
The IRS improved its calculation method starting with migration from 2011 to 2012.11 Data from those years forward are not strictly comparable to data from previous years, and the older data are of a lower quality. For example, older data do not include individuals who filed tax returns after September 30 each year.12 In 2012, about 4% of returns arrived after this date.13 Newer data do include these returns, which is important because those who file late often have more complex returns and higher incomes. If high-income households are the most responsive to differences in tax rates, the older data might have missed a lot of the people most likely to move.
Even under the improved calculation method, individuals may not be counted if their taxpayer identification numbers (TINs) differ from one year to the next. One way this can happen is if someone switches from a temporary TIN to a permanent Social Security number,14 which might be the case if an immigrant worker becomes a permanent resident, and it can also happen due to human error.
What are the trends in Arkansas’s migration patterns?
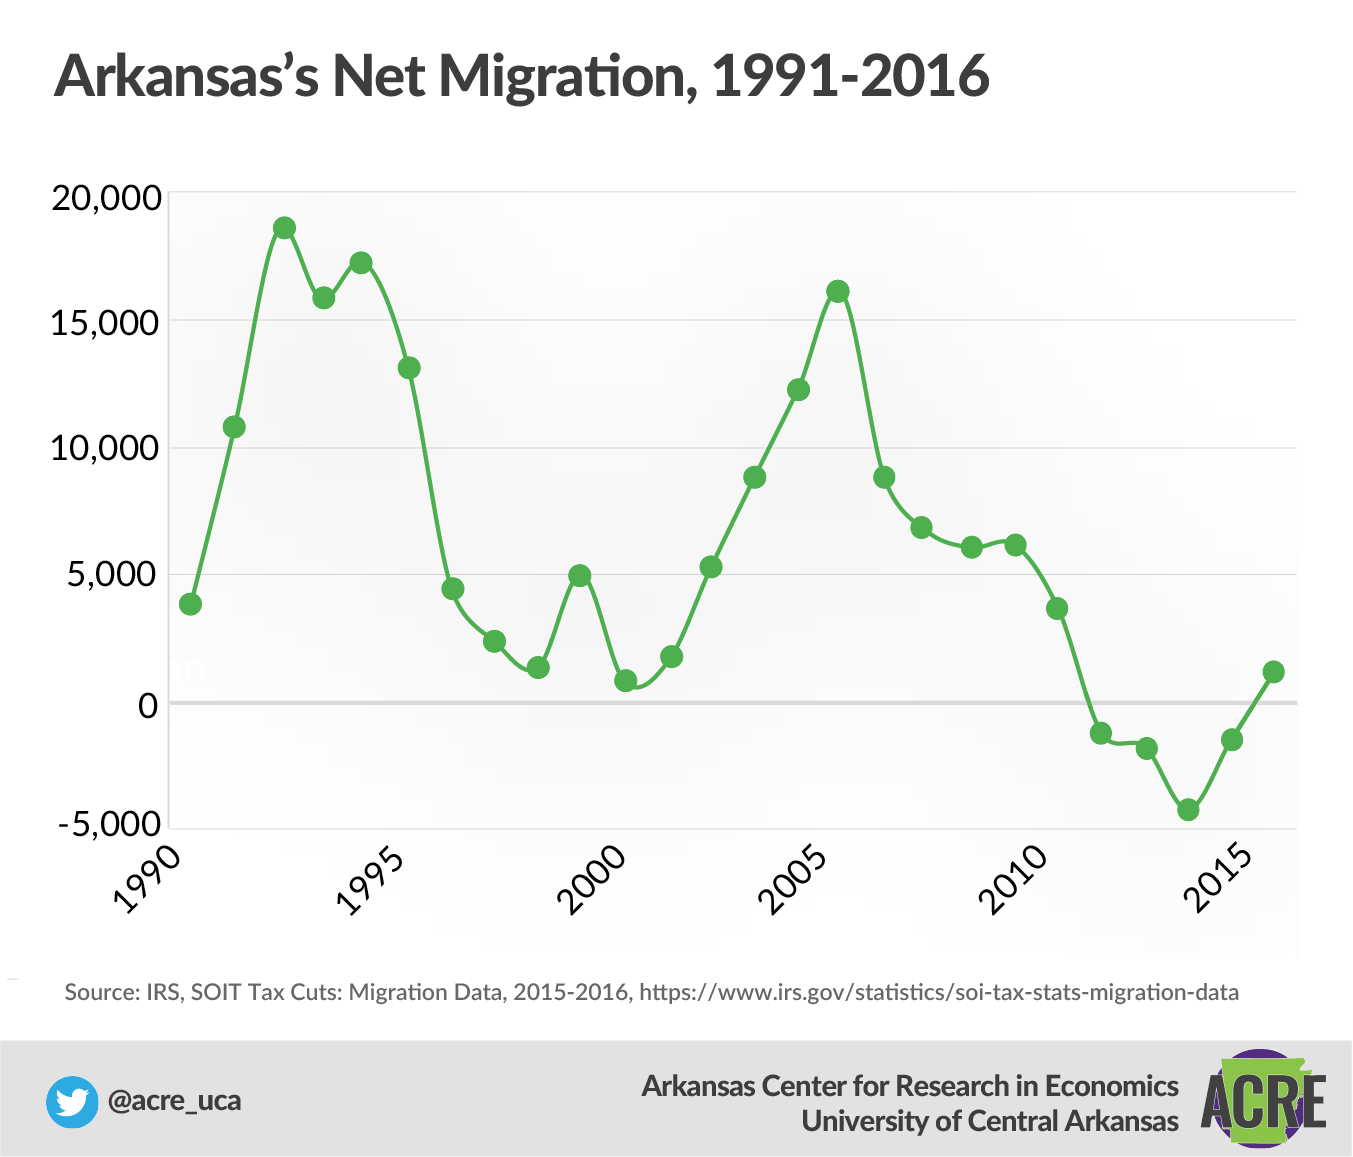
From 1993 to 2011, Arkansas had net positive migration (more people moving into the state than leaving) in every year. During that 18-year period, about 1.17 million people moved into Arkansas from other states, while about 1.04 million moved out of Arkansas. That’s a net gain of about 7,500 people per year. But after 2011, the trend reversed: Arkansas lost population to other states in each year from 2012 to 2015—on average, almost 2,200 people per year. The most recent data for 2016 show that the trend might be reversing again: Arkansas attracted about 1,200 people on net from other states.15
Footnotes:
1 Internal Revenue Service (IRS), Statistics of Income (SOI) Tax Stats: Migration Data, https://www.irs.gov/statistics/soi-tax-stats-migration-data, accessed January 3, 2019; Kevin Pierce, SOI Migration Data: A New Approach, IRS Statistics of Income Bulletin, Summer 2015, https://www.irs.gov/pub/irs-soi/soi-a-inmig-id1509.pdf.
2 IRS, SOI Tax Stats: Migration Data, 2015–2016, https://www.irs.gov/statistics/soi-tax-stats-migration-data-2015-2016.
3 American Immigration Council, Immigrants in Arkansas, fact sheet, October 6, 2017, https://www.americanimmigrationcouncil.org/research/immigrants-arkansas.
4 George J. Borjas, “The Economic Benefits from Immigration,” Journal of Economic Perspectives 9, no. 2 (Spring 1995): 3–22.
5 This figure includes flows between Arkansas and other states and flows between Arkansas and other countries.
6 IRS, SOI Tax Stats: Migration Data, 2015–2016.
7 Joel Kotkin and Wendell Cox, “The States Gaining and Losing The Most Migrants—and Money,” New Geography, September 8, 2016, http://www.newgeography.com/content/005380-the-states-gaining-and-losing-the-mostmigrants-and-money.
8 Ibid.
9 IRS, SOI Tax Stats: Migration Data, 2015–2016.
10 Pierce, SOI Migration Data.
11 Ibid.
12 Ibid.
13 Ibid.
14 Ibid.
15 IRS, SOI Tax Stats: Migration Data, 2015–2016.
There are 12 main chapters in the book, each detailing and explaining and important part of the Arkansas economy. They are Median Household Income; Fortune 500 Companies; Economic Freedom; Personal Income; Wages; Poverty; Migration; Education Attainment; Government Revenue and Spending; Total Nonfarm Payroll Employment; Gross Domestic Product; Unemployment and Labor Force Participation
These 12 chapters were written by expert authors, including: Jeremy Horpedahl, an ACRE scholar and assistant professor of economics at the University of Central Arkansas; Amy Fontinelle, author and editor of hundreds of public policy works; and Greg Kaza, Executive Director of the Arkansas Policy Foundation.
If you are interested in sharing your thoughts and questions about Arkansas’s economy, we would love to hear from you. You can email ACRE at acre@uca.edu, tweet Dr. Jeremy Horpedahl, at @jmhorp, or comment on ACRE’s Facebook page.
If you would like a printed copy for your own home or office, please email acre@uca.edu with the subject line Printed Citizen’s Guide, and include your name, your organization’s name, and your address.