This section, along with the other 11 chapters on the most important parts of the Arkansas economy, are authored by Jeremy Horpedahl, an ACRE scholar and assistant professor of economics at the University of Central Arkansas; Amy Fontinelle, author and editor of hundreds of public policy works; and Greg Kaza, Executive Director of the Arkansas Policy Foundation.
This section is a chapter in a larger work – The Citizen’s Guide to Understanding Arkansas Economic Data.
What is the gross domestic product in Arkansas?
Gross domestic product (GDP) by state, also called gross state product (GSP), measures the output of a state’s economy, typically over one year. It is the state counterpart to US GDP and is considered the broadest measure of economic activity. GDP by state measures the sum of value added from all finished industries in a state. In other words, for all the goods and services produced in a state, GSP measures how much of the products’ final value was created in that state.
The US Bureau of Economic Analysis (BEA) compiles GDP by state and within states by various sectors of the economy. Some examples of the BEA’s 21 sectors are construction, durable goods manufacturing, retail trade, government, federal military, and health care and social assistance.1
The private industry sectors that contribute the most to Arkansas’s GDP are:
• finance, insurance,real estate,rental,and leasing;
• manufacturing; and
• professional and business services.2
The government sector is also large, encompassing all levels of government, including the military; it would be the third largest sector if ranked as a private industry.3 Arkansas’s largest industries largely mirror the nation’s largest industries:
• finance, insurance,real estate,rental,and leasing;
• government;
• professional and business services; and
• manufacturing.4
Arkansas’s largest industries haven’t changed much since 1997,5 except that professional and business services has moved up in the ranking, replacing retail trade.
Why is GDP by state important to Arkansas?
GDP by state shows how a state’s economy is evolving over time. It also lets us compare one state’s economy with other states’ economies, though comparisons make more sense after correcting for population differences. Private sector GDP is also a rough measurement of the total potential tax base from which the government can draw its revenue.
What about population differences across states?
Without adjusting for differences in population, GDP does not allow us to make meaningful comparisons across states. For example, Texas’s GDP is much higher than surrounding states’, but Texas is also the second largest US state by population, so we would expect its GDP to be much higher.
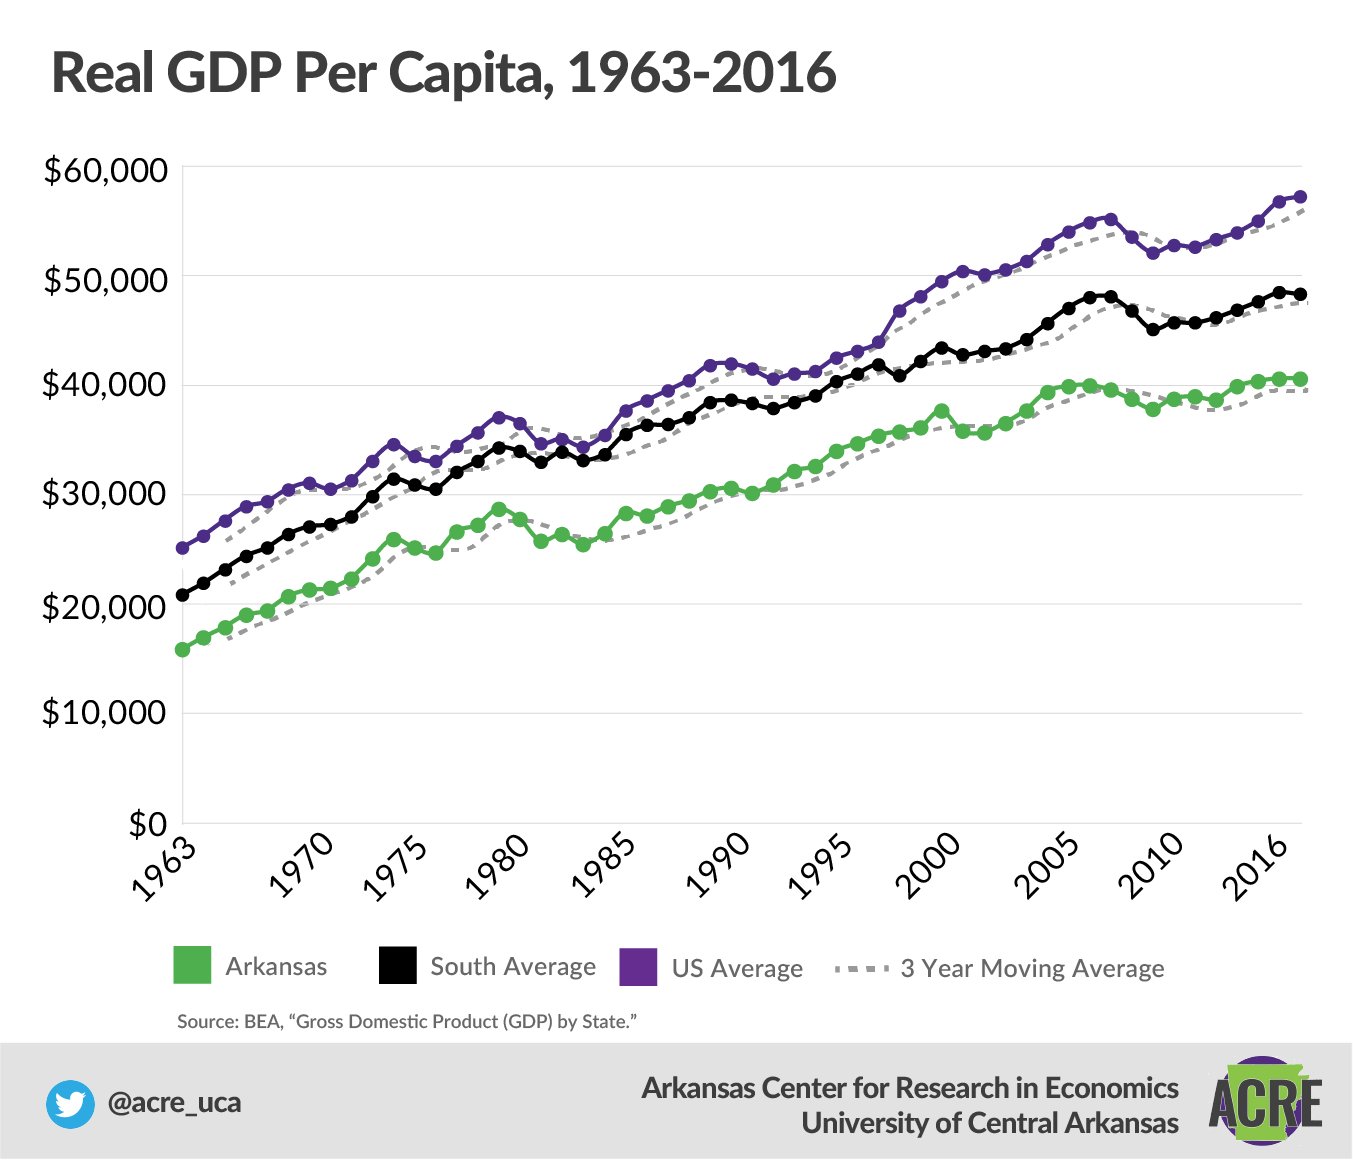
When we look at GDP on a per person basis, we can get another estimate of average income (slightly different from the personal income discussed in the earlier “Income” section). Using this measure, we see that the average Arkansan has about 71% of the income of the average American. In 1963, Arkansas per capita GDP was only about 63% of the national average, so the gap has closed, although Arkansas was over 80% of the national average in the early 1990s. The gap had been closed to a much larger degree. Arkansas also trails the average for the US South region, which almost equaled the US average in the early 1980s and early 1990s, but today is about 84.5% of the national average.
Are there parts of the economy that GDP does not measure?
GDP does not include an estimate of the underground economy (legal, but untaxed or “under the table” transactions) or household production. These two areas are potentially quite large, though they can only be estimated since there is no record of the transactions in the underground economy and no money changes hands in household production (for example, when a family cooks dinner rather than paying a restaurant to cook for them). Rough estimates at the national level for the United States are that about 10% of the total economy is underground,6 and about 20% of the economy is household production.7 These numbers can vary across states and across time (such as during recessions).
Is higher GDP always a good sign?
Some forms of production included in GDP may not be desirable or may be signs of societal problems. For example, in a state with high crime rates, people will spend more on locks, guns, and security systems. While people do benefit from these goods, the state’s GDP numbers will not be strictly comparable to those of a neighboring state with lower crime rates. Similarly, one state may spend considerable resources cleaning up environmental pollution, contributing to GDP, whereas another state may simply have less pollution to begin with and have a lower GDP as a result.
Does GDP include purchases by businesses?
By design, GDP by state does not measure purchases of intermediate goods. Intermediate goods are sold from one business to another in the production process rather than to final consumers. These goods are subtracted from total GDP to prevent double counting, which would occur if they were counted both when a business purchased them and again when they were sold to a consumer as part of a finished product.
What is the trend in Arkansas’s annual GDP?
Arkansas’s annual GDP has increased in most years over the past 20 years, with the exceptions of 2000, 2007, 2008, 2009, and 2012 (all in inflation adjusted terms).8 It has increased by about 34% over the last 20 years, from $90.3 billion in 1997 to $121.4 billion in 2016 (all stated in inflation-adjusted 2016 dollars). To put that 34% number in context, it’s also useful to note that Arkansas’s population grew by about 15% over that period,9 and US GDP grew by about 45%, while US population grew by 18.5%.10 In per person terms, Arkansas grew more slowly than the United States as a whole.
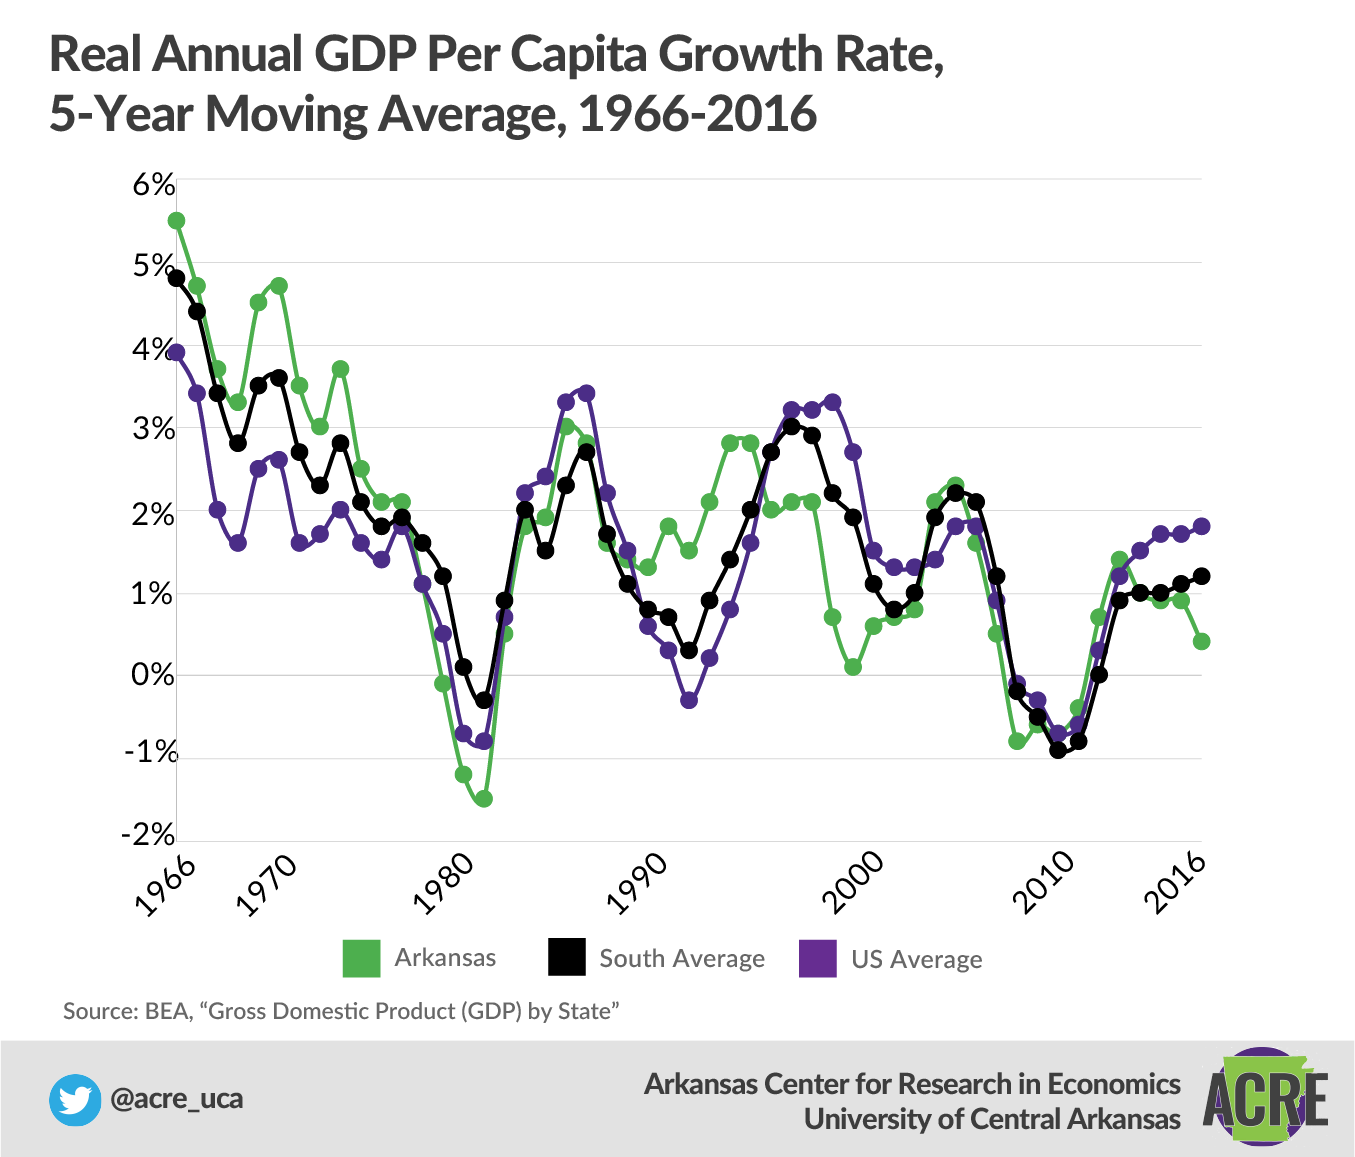
Arkansas’s GDP growth rate is also more volatile in some years than the US or the South region. Peaks in GDP growth in the 1960s and 1970s were much higher, but the downside was also much lower, especially in the early 1980s. Since then, Arkansas’s GDP growth has been more stable, but in recent years our growth rate has been consistently below the national average.
Footnotes:
1 US Bureau of Economic Analysis, Industry List C. RIMS II 21 Row Industry Codes, https://www.bea.gov/regional/rims/rimsii/download/21IndustryListC.pdf.
2 To view the data we used, start at https://www.bea.gov/iTable/iTableHtml.cfm?reqid=70&step=1&isuri=1&acrdn=1, select “Annual Gross Domestic Product by State,” select “GDP in Current Dollars,” select “NAICS,” select “All Industries,” select “Arkansas” and “Levels,” then select 2016.
3 Ibid.
4 Ibid., but search for United States instead of Arkansas.
5 Before 1997, the government used a slightly different industry classification system, so the data aren’t strictly comparable.
6 See table 4 (p. 11) in Friedrich Schneider and Dominik Enste, “Shadow Economies around the World: Size, Causes, and Consequences,” IMF working paper WP/00/26, February 2000, https://www.imf.org/external/pubs/ft/wp/2000/wp0026.pdf, which has estimates of 6.7% to 13.9% for the United States.
7 See estimates in Benjamin Bridgman et al., “Accounting for Household Production in the National Accounts, 1965–2010,” Survey of Current Business, May 2012, https://www.bea.gov/scb/pdf/2012/05%20May/0512_household.pdf, which suggest that including household production raises GDP by about 26% (implying that it would be 20% of the total economy).
8 To view the data we used, go to www.bea.gov, select the “Interactive Data” tab, select “GDP and Personal Income,” then select “Begin Using the Data.” Select “Annual Gross Domestic Product by State,” select “GDP in Current Dollars,” select “NAICS (1997 forward),” select “All Industries,” select “Arkansas” and “Levels,” and select “All Years.” Data adjusted from current dollars to 2016 dollars by the author.
9 For Arkansas’s population in 1997, see “Time Series of Arkansas Intercensal Population Estimates by County: April 1, 1990 to April 1, 2000,” https://www2.census.gov/programs-surveys/popest/tables/1990-2000/intercensal/st-co/co-est2001-12-05.pdf; for US population in 1997, see “Monthly Estimates of the United States Population: April 1, 1980 to July 1, 1999, with Short-Term Projections to November 1, 2000,” https://www2.census.gov/programs-surveys/popest/tables/1990-2000/national/totals/nat-total.txt. For Arkansas and US population in 2016, see “Table 1. Annual Estimates of the Resident Population for the United States, Regions, States, and Puerto Rico: April 1, 2010 to July 1, 2017,” https://www2.census.gov/programs-surveys/popest/tables/2010-2017/state/totals/nst-est2017-01.xlsx. We use July population data when multiple months are available.
10 Ibid. Search also for United States in addition to Arkansas.
There are 12 main chapters in the book, each detailing and explaining and important part of the Arkansas economy. They are Median Household Income; Fortune 500 Companies; Economic Freedom; Personal Income; Wages; Poverty; Migration; Education Attainment; Government Revenue and Spending; Total Nonfarm Payroll Employment; Gross Domestic Product; Unemployment and Labor Force Participation
These 12 chapters were written by expert authors, including: Jeremy Horpedahl, an ACRE scholar and assistant professor of economics at the University of Central Arkansas; Amy Fontinelle, author and editor of hundreds of public policy works; and Greg Kaza, Executive Director of the Arkansas Policy Foundation.
If you are interested in sharing your thoughts and questions about Arkansas’s economy, we would love to hear from you. You can email ACRE at acre@uca.edu, tweet Dr. Jeremy Horpedahl, at @jmhorp, or comment on ACRE’s Facebook page.
If you would like a printed copy for your own home or office, please email acre@uca.edu with the subject line Printed Citizen’s Guide, and include your name, your organization’s name, and your address.