This section, along with the other 11 chapters on the most important parts of the Arkansas economy, are authored by Jeremy Horpedahl, an ACRE scholar and assistant professor of economics at the University of Central Arkansas; Amy Fontinelle, author and editor of hundreds of public policy works; and Greg Kaza, Executive Director of the Arkansas Policy Foundation.
This section is a chapter in a larger work – The Citizen’s Guide to Understanding Arkansas Economic Data.
What are government revenue and spending?
Government revenue is the money the state government receives from all the taxes Arkansans pay, voluntary fees Arkansans pay (such as college tuition), and transfers from the federal government. The major tax types are personal and corporate income taxes, general sales taxes, and property taxes; these make up 82% of state and local government tax revenue in Arkansas, or 58% of all revenue when we include revenue other than taxes. Minor tax types include cigarette and tobacco taxes, alcohol taxes, gas and transportation taxes, motor vehicle taxes, hotel and tourism taxes, and cell phone and wireless taxes; these make up 18% of state and local government tax revenue in Arkansas.1
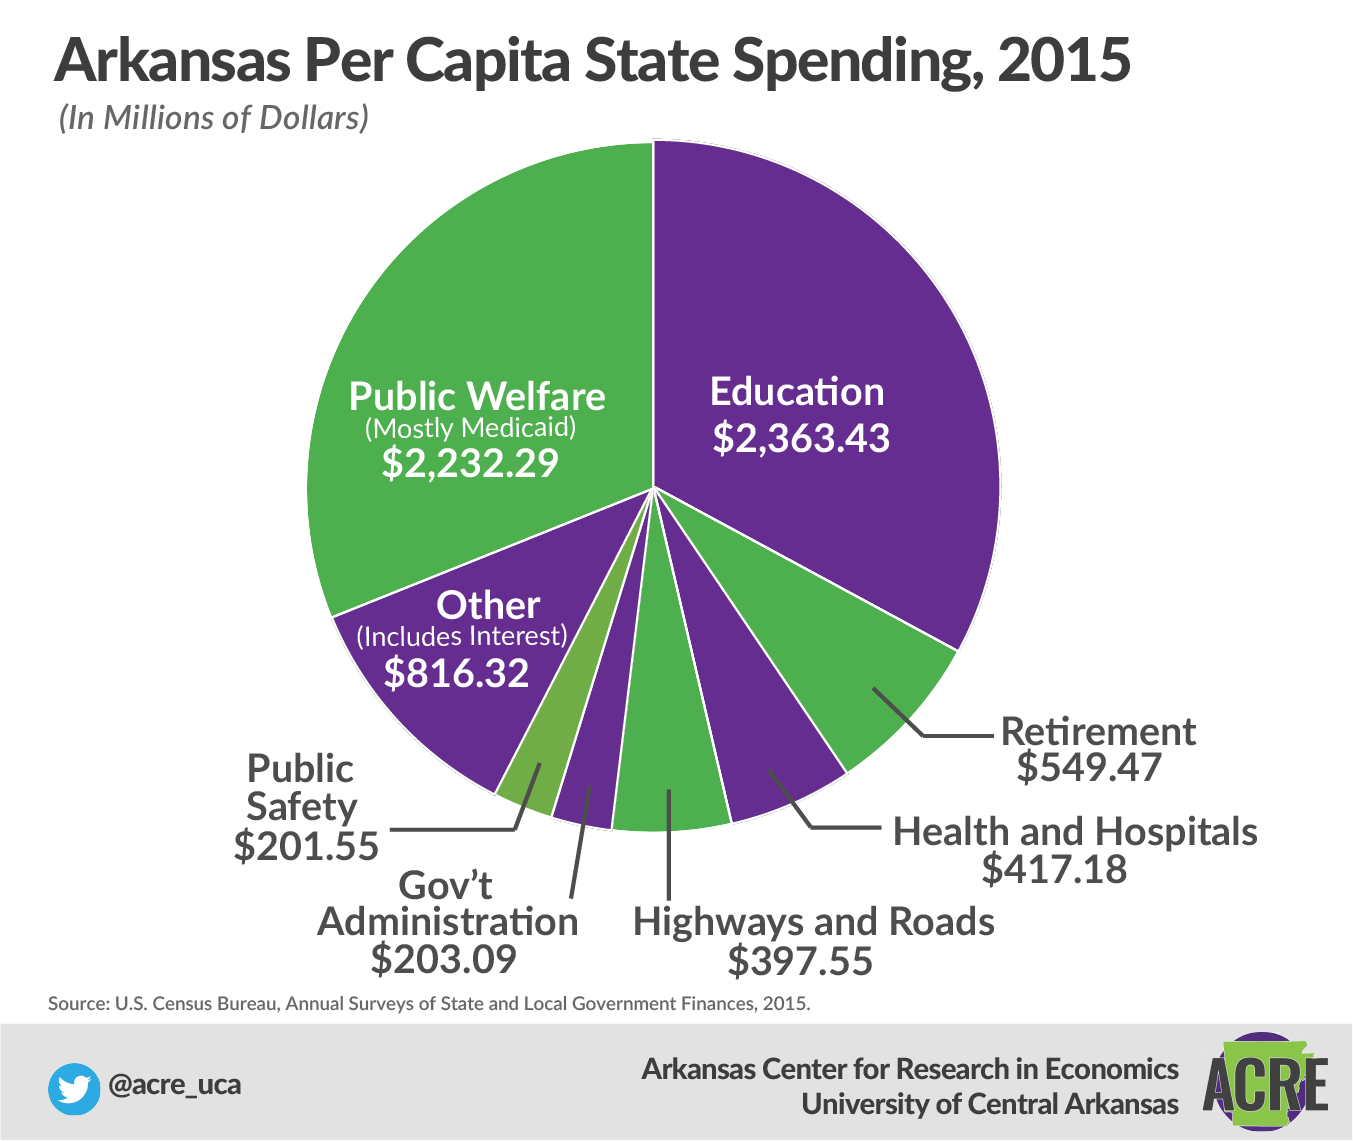
Government spending is all the money the state spends on goods and services for constituents, on the salaries of government workers, and on transfer payments to individuals and families in the state. In Arkansas, the largest areas of government spending, ordered from highest to lowest, are these seven:2
• education (about 61% on K–12, 31% on higher education, and 8% on other education)
• public welfare (mostly Medicaid)
• highways and roads
• public safety (including police, fire protection, and prisons)
• public employee retirement plans
• health and hospitals (other than Medicaid)
• general government administration
Government spending in Arkansas is sensitive to tax-system changes because of the state’s Revenue Stabilization Act of 1945. The act prevents budget deficits by ensuring that programs are not funded if there isn’t enough revenue to pay for them. The legislature ranks the spending programs into priority groups, and those that the legislature doesn’t prioritize are only partially funded or are not funded at all in years when revenue falls below projections. Programs are ranked through a bill passed by the legislature that amends the 1945 act.3
Government revenue funds programs that private spending only partially covers, such as education, roads and highways, and health care, or does not cover at all, such as police and fire departments, parks, and prisons. When there isn’t enough revenue to cover spending, key services may be cut.
For example, the 2008–09 fiscal year saw a drop-off in state revenue because of the Great Recession. That year, the legislature put spending into three categories: A, A1, and B. By the end of the year, categories A and A1 were fully funded, but the remaining revenue could fund only 63.6% of category B. As a result, tens of millions of dollars were cut from human services, higher education, the state general fund, and county aid, and a few million dollars were cut from various K–12 public school funds.4
How does Arkansas’s government spending compare to the surrounding states?
Arkansas’s state government spending per capita is higher than that of any surrounding state. It’s also higher than that of Alabama, Florida, Georgia, North Carolina, South Carolina, and Virginia.5 But it’s higher for a specific reason: Arkansas has a very centralized system of government spending.
About 81% of government spending in Arkansas occurs at the state level. This percentage is the fifth highest in the nation, with the national average about 63%. When you include local government spending, Arkansas ranks more in the middle of the pack among its neighbors: much higher than Texas, Oklahoma, Missouri, and Tennessee, but much lower than Louisiana and Mississippi. In total, state and local government spending equals about 37% of personal income in Arkansas—a higher percentage than 34 other states.6
How does Arkansas rank nationally for government revenue and spending?
As described earlier, not all government revenue comes from taxes: in Arkansas, only about half of total government revenue is from taxes. Across the three types of taxes, Arkansas has high sales tax collections, mid-level income tax collections, and low property tax collections compared to other states. And since Arkansas is a relatively low-income state, if we divided these numbers by personal income, Arkansas’s taxes would look even higher compared to the rest of the nation.
According to the Tax Foundation,7 here’s how Arkansas ranks nationally on various categories of government revenue, especially taxes:
• State tax collections per capita,
FY 2016:. . . . . . . . . . . . 13th, at $3,163
• State and local tax collections per capita,
FY 2015:. . . . . . . . . . . . 34th, at $3,868
• State revenue per capita,
FY 2015:8. . . . . . . . . . . . 17th, at $6,507
• State and local revenue per capita,
FY 2015:. . . . . . . . . . . . 36th, at $7,934
• State and local general sales tax collections per capita,
FY 2015:. . . . . . . . . . . . 11th, at $1,433
• State and local individual income tax collections per capita,
FY 2015:. . . . . . . . . . . . . .31st, at $895
• State and local property tax collections per capita,
FY 2015:. . . . . . . . . . . . . 48th, at $699
According to the US Census Bureau, Arkansas’s state and local spending per capita was $7,851 in 2015 and $7,496 in 2017, ranking 15th in the nation in both years.9
What information can’t we get from per capita government spending?
How much Arkansas spends per person depends on how many people are eligible to receive a given service, how many eligible people choose to receive that service, and how much it costs to provide that service for each person.10 For example, not everyone who is eligible for Medicaid uses its benefits, and many Arkansans never set foot in the state’s parks. To explain it another way, Arkansas ranks 33rd in per capita spending on K–12 education, but this doesn’t necessarily mean Arkansas should be spending as much as first-place Alaska in an attempt to improve education outcomes. Demographic factors such as how many school-age children a state has and how many children attend public schools also affect spending.11
What are the trends in Arkansas’s government spending?
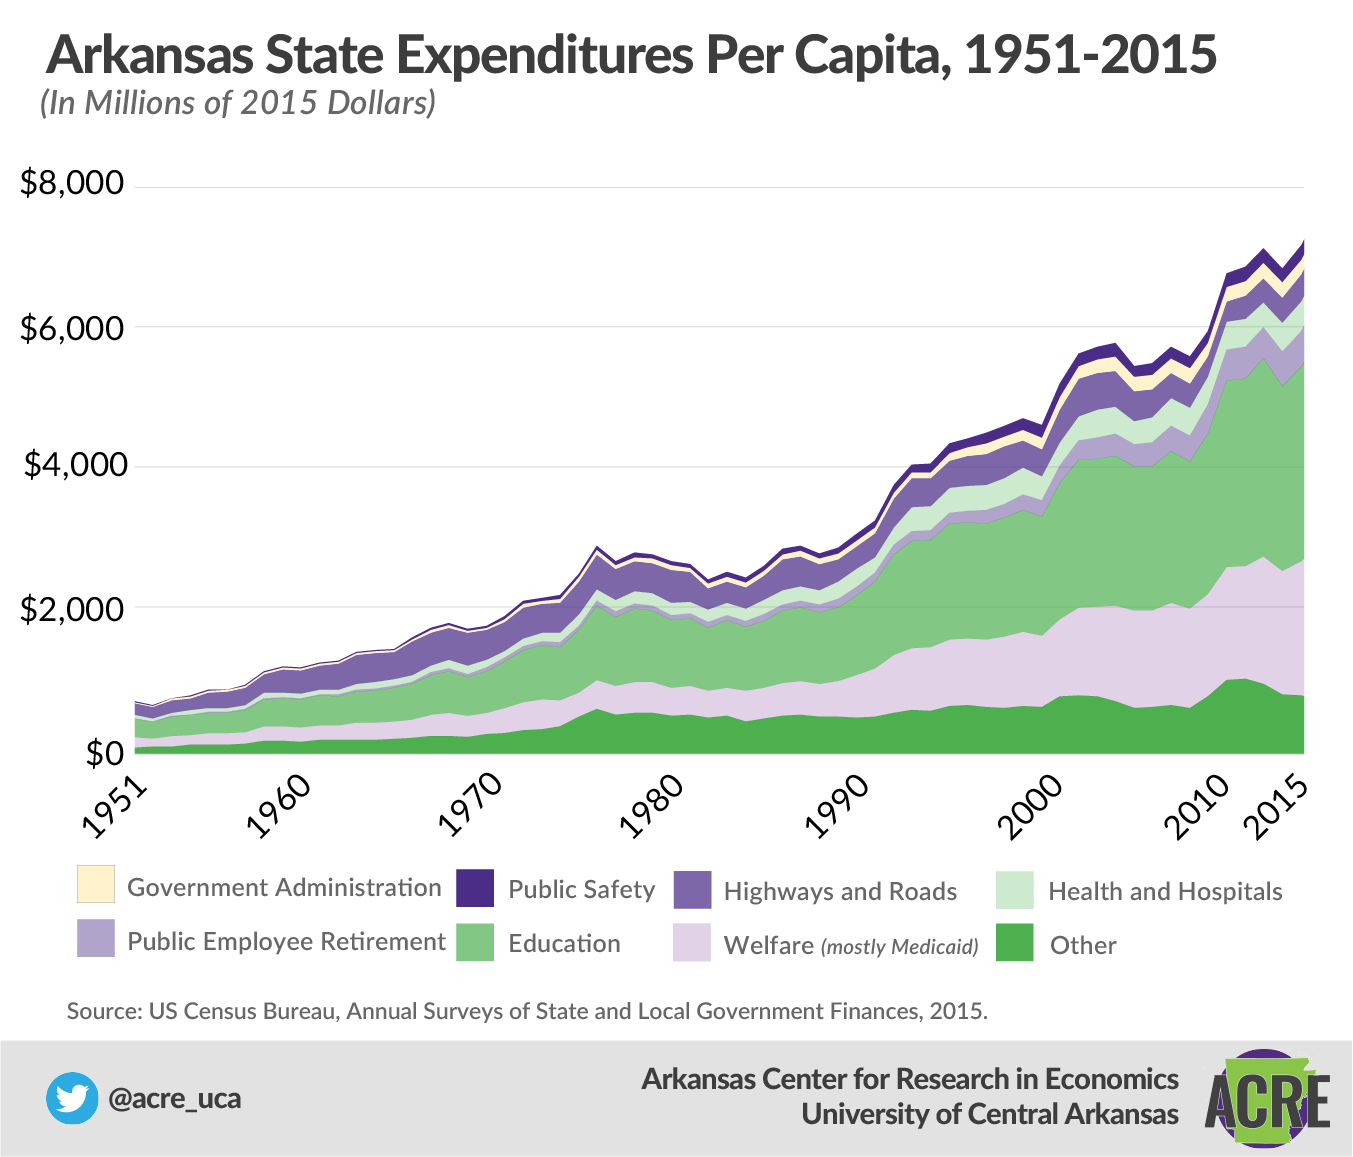
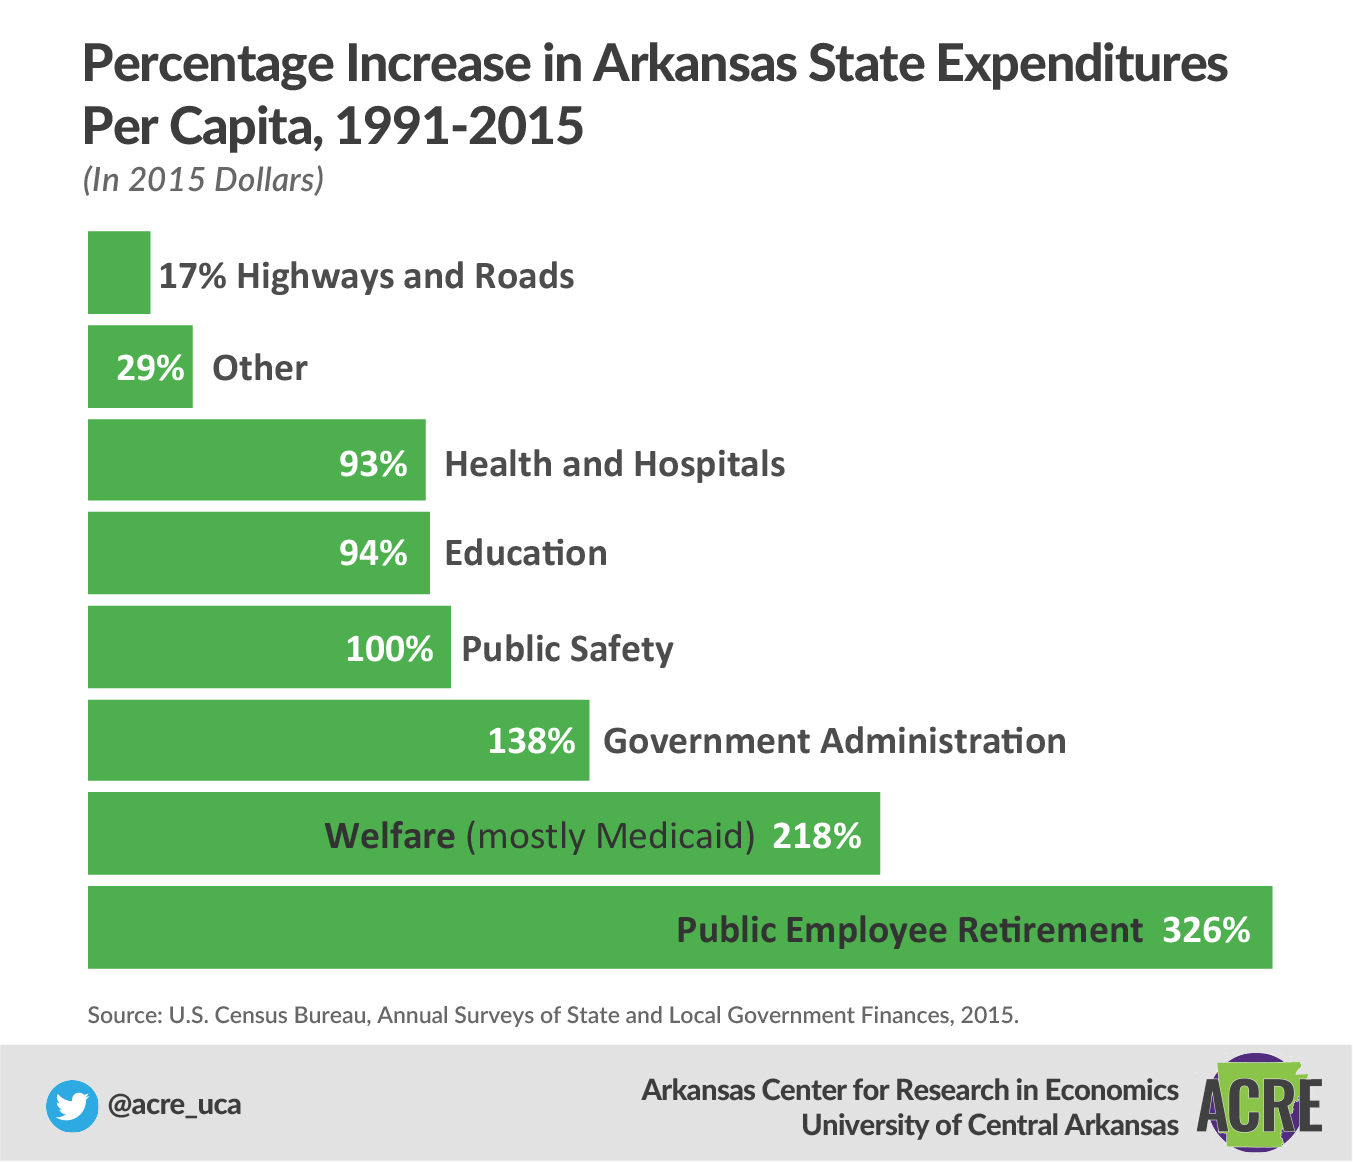
From 1991 to 2015, Arkansas’s state government spending grew by 110%—and yes, that figure is adjusted for inflation and population growth. Similar states spend an average of $5,763 per capita, while Arkansas spends $7,176: that’s 25% more.12 But it’s important to remember that these data are slightly biased by Arkansas’s highly centralized system of state finance.
If we go back even further in time, to 1951 (the year for which we have some of the earliest comparable state data), state government spending in Arkansas, adjusted for inflation and population, was only $742 per person. State government spending has increased by 868% since then, even after making the proper adjustments.13
We have also considered the effect of federal transfers on Arkansas’s spending. Federal transfers are allocations of federal tax dollars to the states to support services such as Medicaid, the Supplemental Nutrition Assistance Program, the Low Income Home Energy Assistance Program, Temporary Assistance for Needy Families, and the Special Supplemental Nutrition Program for Women, Infants, and Children. Arkansas’s per capita spending is much higher than that of similar states even after subtracting federal transfers from state government spending.14
Doesn’t high state spending mean that Arkansans are receiving lots of public goods and services?
Mostly no. Arkansas spends more today to fund nearly the same services as it did in the early 1990s, which suggests that state spending has become less efficient. One area of spending that has grown due to policy changes is healthcare: specifically, access to Medicaid. Spending has increased most significantly on education, in part due to lawsuits from school districts claiming that the state was not living up to its constitutional requirements to fund education (the courts mostly agreed with the school districts). Public pensions and public safety (especially prisons and corrections) have also seen major spending increases at the state level. Public pensions do have a dedicated revenue source from salary contributions, though unfunded liabilities are as much a concern in Arkansas as they are in most states. Finally, spending on public safety has increased dramatically over a period when crime has fallen in Arkansas and across the nation.15
Footnotes:
1 Data are for 2015 and come from the US Census Bureau’s State and Local Government Finance survey, https://www.census.gov/govs/local/.
2 Ibid.
3 Jeremy Horpedahl and Jacob Bundrick, There’s Nothing Natural about the State of Government Spending in Arkansas (Arlington, VA: Mercatus Center at George Mason University, August 8, 2017), https://www.mercatus.org/publications/government-spending-arkansas.
4 The spending categories were established in Act 1201 of the 2007 session of the Arkansas General Assembly. Revenue data are from the Arkansas Bureau of Legislative Research, “Selected Statistical Financial Data for Arkansas,” October 2016, http://www.arkleg.state.ar.us/assembly/2017/Summary%20Budget%20Manuals/2016_B_BOOK.PDF, p. 73.
5 Horpedahl and Bundrick, There’s Nothing Natural about the State of Government Spending in Arkansas.
6 All numbers in this paragraph are the authors’ calculations using US Census Bureau, “Annual Survey of State and Local Government Finances,” and US Census Bureau, “American Community Survey,” 2015.
7 Tax Foundation, “Facts and Figures: How Does Your State Compare?” Washington, DC: Tax Foundation, 2018, https://files.taxfoundation.org/20180411102900/Facts-Figures-2018-How-Does-Your-State-Compare.pdf.
8 Total tax collections per capita differ from state revenue per capita because states receive significant funds from the federal government.
9 Tax Policy Center, “State and Local Direct General Expenditures, Per Capita 1977 to 2015,” https://www.taxpolicycenter.org/statistics/state-and-local-directgeneral-expenditures-capita, accessed January 3, 2019.
10 Urban Institute, “What Everyone Should Know about Their State’s Budget,” January 2017, http://apps.urban.org/features/what-drives-state-spending/.
11 Ibid.
12 Horpedahl and Bundrick, There’s Nothing Natural about the State of Government Spending in Arkansas; figures adjusted from 2013 to 2015 dollars.
13 Ibid.
14 Horpedahl and Bundrick, There’s Nothing Natural about the State of Government Spending in Arkansas.
15 Ibid.
There are 12 main chapters in the book, each detailing and explaining and important part of the Arkansas economy. They are Median Household Income; Fortune 500 Companies; Economic Freedom; Personal Income; Wages; Poverty; Migration; Education Attainment; Government Revenue and Spending; Total Nonfarm Payroll Employment; Gross Domestic Product; Unemployment and Labor Force Participation
These 12 chapters were written by expert authors, including: Jeremy Horpedahl, an ACRE scholar and assistant professor of economics at the University of Central Arkansas; Amy Fontinelle, author and editor of hundreds of public policy works; and Greg Kaza, Executive Director of the Arkansas Policy Foundation.
If you are interested in sharing your thoughts and questions about Arkansas’s economy, we would love to hear from you. You can email ACRE at acre@uca.edu, tweet Dr. Jeremy Horpedahl, at @jmhorp, or comment on ACRE’s Facebook page.
If you would like a printed copy for your own home or office, please email acre@uca.edu with the subject line Printed Citizen’s Guide, and include your name, your organization’s name, and your address.