This section, along with the other 11 chapters on the most important parts of the Arkansas economy, are authored by Jeremy Horpedahl, an ACRE scholar and assistant professor of economics at the University of Central Arkansas; Amy Fontinelle, author and editor of hundreds of public policy works; and Greg Kaza, Executive Director of the Arkansas Policy Foundation.
This section is a chapter in a larger work – The Citizen’s Guide to Understanding Arkansas Economic Data.
How does Arkansas rank for educational attainment?

As of 2016, 86% of Arkansans age 25 or older had at least a high school diploma or high school equivalency certificate, compared with 87.5% of all Americans. While Arkansas is close to the national average, that still puts us in 42nd place among all 50 states and the District of Columbia. Looking again at Arkansans who are 25 or older, in 2016, just 22.4% had a four-year college degree, compared with 31.3% of all Americans, putting Arkansas in 49th place.1
One common standardized test in the United States is the National Assessment of Education Progress (NAEP). The NAEP is administered nationwide and tests students at the fourth and eighth grade levels in many subjects, most commonly mathematics and reading. Not only do states get raw scores, but the NAEP also indicates the percentage of students performing at various levels, such as “basic” or “proficient.”
The latest results available are from 2017. For eighth grade students in Arkansas, only 25% are considered proficient in mathematics while only 29% are considered proficient in reading. Nationwide, the results are not much better, with 34% of eighth graders proficient in mathematics and 36% proficient in reading (Massachusetts has the best results, with about half of students proficient in each subject).
With those scores, Arkansas students rank 44th in mathematics and 41st in reading nationally. That’s the bad news. The good news is that Arkansas, like most states, has seen dramatic improvements in recent years: in 1990, just 9% of Arkansas eighth graders were proficient in mathematics. In 1998, only 23% of Arkansas eighth graders were proficient in reading.2 While these are big improvements, we still need to make major progress.3
Another set of standardized tests to examine are college entrance exams, such as the ACT and SAT. Using statistics from these exams can be challenging, since not all students graduating from high school take them. Also, the preference for which exam to take (ACT or SAT) varies by region and by state. The tests also don’t account for high school dropouts. But for Arkansas we can use the ACT data as a reliable indicator of high school graduates’ skills since about 96% of graduates take that test (only about 3% of Arkansas graduates take the SAT).4
For Arkansas high school graduates, the mean composite ACT score in 2016 was 20.2 out of a possible 36 points. This score compares favorably to the national average of 20.8 among high school graduates, about 59% of whom take the ACT. Comparing Arkansas to other states is challenging because of the variations in exam preference, but in 18 states, 100% of high school graduates take the ACT, including all of Arkansas’s neighboring states except Texas and Oklahoma. (Fewer than half take it in Texas, and 82% take it in Oklahoma.) Examining this group of 19 states (the states where 100% take the test, plus Arkansas), Arkansas ranks above the middle of the pack at eighth place.
How does Arkansas’s educational attainment compare to its neighbors?
Arkansas’s neighboring states also generally rank low in educational achievement. While Arkansas is ranked 49th in the number of adults with a college degree, only two of our neighbors are ranked above 40th place: Texas is 32nd and Missouri is 34th. For high school graduation, the picture is not much different, although Texas falls to 50th place.5 Among our neighboring states that favor the ACT, Arkansas ties with Missouri and ranks higher than Tennessee, Louisiana, and Mississippi.6
How is educational attainment measured?
Educational attainment measures how many years of education people have completed and what degrees they’ve earned. Using educational attainment statistics, we can see how many people have earned high school, college, master’s, and doctoral degrees. We can also see how many people did not graduate from high school or college and what grade level they completed, as well as how many people have no formal education whatsoever.
Why is educational attainment important to Arkansans?
Education is a key to economic development. More educated workers tend to be more productive, which means they earn more. Thus, education helps to reduce poverty.7 According to the World Bank, each additional year of schooling increases wages by 10% per year, making education the best investment individuals and governments can make.8 Science, technology, engineering, and mathematics (STEM) majors earn the highest returns, with an average annual wage of $76,000, while the those in the teaching and serving category have the lowest, with an average annual wage of $46,000. High school graduates earn an average annual wage of $36,000.9
A more productive economy improves living standards not just for those workers who earn higher wages, but for everyone who benefits from the products and services they provide and the innovations they develop. And education teaches problem-solving, learning, communication, self-management, and social skills, all of which contribute to success in the labor market and in life.10
Are student loans a good way to improve educational attainment in Arkansas?
While many students incur debt for higher education, the rate of return (in terms of higher lifetime wages) on investing that money in a college degree is more than double the return of the stock market and more than five times the return of bonds. In other words, if someone gave you $100,000 to invest, a college degree would be among your best investment options.11
How do we measure educational quality in Arkansas?
No perfect measure of how much students are learning exists, but standardized test scores are one measure to look at. Comparisons across states are difficult, since they do not necessarily reflect differences in the quality of the teachers and schools themselves, but reflect an interaction between the quality of the teachers and schools, and the advantages or disadvantages students bring into the classroom. For example, students from low-income families (or lowincome states) might be expected to perform worse on standardized tests than students from high-income families (or high-income states). Still, the schools could be helping students earn higher scores; we can’t judge a snapshot in isolation.
How does Arkansas’s education spending compare to its neighboring states?
In total, Arkansas spends about $2,750 per capita (including all Arkansans) on education, ranking Arkansas 32nd in the nation. But that figure might be misleading, since the number of young people varies by state; the mix of private and public schools varies by state; and all spending (K–12, college, and vocational) is placed into one category. A better measure is government spending in K–12 public schools per student enrolled in those schools. By this measure, Arkansas spends about $10,200 per student, ranking our state 37th. Nationwide, pending averages about $12,100 per student, with highs of $30,300 in the District of Columbia and $23,500 in New York. At the low end, a few states spend less than $7,000 per student.12
How can we improve educational attainment in Arkansas?
Educational attainment in Arkansas could increase by ensuring that more students attain at least a thirdgrade reading level, improving STEM education, engaging more parents in their children’s education, decreasing the dropout rate,13 and increasing the college graduation rate.14 Narrowing the achievement gap for economically disadvantaged students and racial and ethnic minority students is another important goal.15 Arkansans would also benefit if more postsecondary students earned career and technical certificates or associate’s degrees.16
In what areas does Arkansas excel in education?
The University of Arkansas is ranked in the top 2% of research universities in the nation by the Carnegie Foundation for the Advancement of Teaching.17 It is also the country’s 10th-fastest-growing public research university.18 In the U.S. News and World Report Best High Schools rankings, Arkansas has one gold medal high school: Haas Hall Academy, a public charter school in Fayetteville that ranks 50th nationally.19 Arkansas also has 26 silver-medal schools.20
What percentage of Arkansas schools are public vs. private?
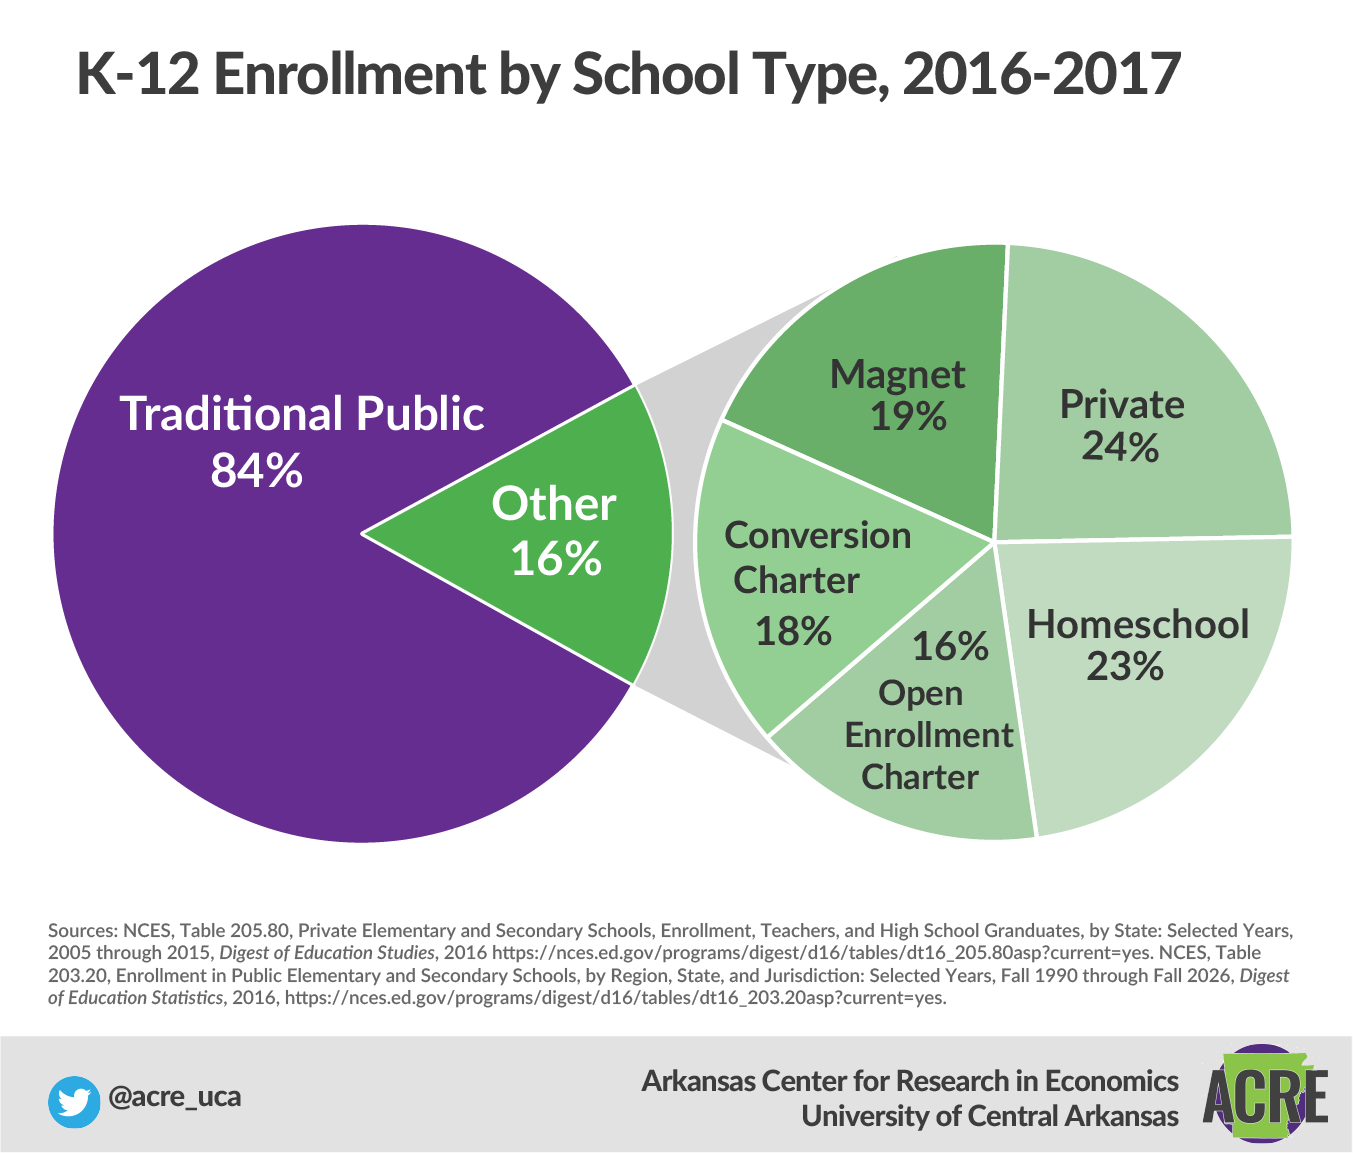
The vast majority of Arkansas students in grades K–12 attend public schools. In 2015, only about 38,000 students attended private schools versus about 491,600 in public schools. In other words, only about 7% of primary and secondary students in Arkansas were enrolled in private schools.21
Arkansas also has a number of public charter schools, which are publicly funded but have more autonomy to determine standards for what to teach and whom to hire as teachers. The number of students attending public charter schools in Arkansas has grown in recent years. With 28,200 students attending public charter schools, enrollment rivals that of private schools.22 Another similarly sized group is those educated at home: about 19,000 are homeschooled.23
How are public schools funded in Arkansas?
Primary and secondary schools in Arkansas are primarily operated and funded at the local level, but the state also plays an important role. Arkansas’s constitution requires all school districts to impose a minimum property tax of 25 mills (the term for property tax rates) for funding schools. The state also provides foundation funding, a minimum amount of funding per student, set at $6,781 per student for the 2018 –19 school year.
If the school district’s mandatory 25 mills tax does not add up to $6,781 per student, the state gives the district the difference (only eight school districts generated that much revenue from the tax alone in 2017–18). If they choose, school districts can impose additional property taxes, and that revenue stays in the district. This process ensures a minimum level of funding for each school district, regardless of how poor the district is. However, it does not guarantee that every student will get the same quality of education.24
Footnotes:
1 US Census Bureau, American Community Survey, 2016. Rankings include the District of Columbia, and are thus out of 51.
2 How do we know that the NAEP test hasn’t been made easier over the years so the results are less dismal? Because the test is designed (in part) to be used for comparisons over time. If the test creators made it easier or harder every year, they would be defeating one of the test’s key purposes. See National Center for Education Statistics (NCES), “Interpreting NAEP Long-Term Trend Results,” last updated August 22, 2013, https://nces.ed.gov/nationsreportcard/ltt/interpreting_results.aspx.
3 NAEP data include Washington, DC, in the rankings, and the earlier year comparisons (1990 and 1998) were the earliest available for those subjects. See the Nation’s Report Card, NAEP Mathematics Report Card, https://www.nationsreportcard.gov/math_2017/, and NAEP Reading Report Card, https://www.nationsreportcard.gov/reading_2017/.
4 NCES, Table 226.60, Average ACT Scores and Percentage of Graduates Taking the ACT, by State: 2012 and 2016, Digest of Education Statistics, 2016, https://nces.ed.gov/programs/digest/d16/tables/dt16_226.60.asp?current=yes; NCES, Table 226.40, SAT Mean Scores, Standard Deviations, and Score Ranges for High School Seniors, and Percentage of the Graduating Class Taking the SAT, by State: 2017, Digest of Education Statistics, 2017, https://nces.ed.gov/programs/digest/d17/tables/dt17_226.40.asp?current=yes.
5 California is last, in 51st place; for high school graduation rates, the size of the foreign-born population is an important factor.
6 NCES, Table 226.60
7 Harry A. Patrinos, “Why Education Matters for Economic Development,” Education for Global Development (blog), World Bank, May 17, 2016, http://blogs.worldbank.org/education/why-education-matters-economic-development.
8 Ibid.
9 Anthony P. Carnevale, Ban Cheah, and Andrew R. Hanson, “The Economic Value of College Majors,” Georgetown University Center on Education and the Workforce, 2015, https://cew.georgetown.edu/cew-reports/valueofcollegemajors/#full-report.
10 Patrinos, “Why Education Matters.”
11 Michael Greenstone and Adam Looney, “Where Is the Best Place to Invest $102,000: In Stocks, Bonds, or a College Degree?” Hamilton Project, June 2011, http://www.hamiltonproject.org/assets/legacy/files/downloads_and_links/06_college_value.pdf.
12 Data are for 2015, the most recent comparable year across states. Spending data come from the US Census Bureau’s Annual Survey of State and Local Government Finances for 2015, https://www.census.gov/govs/local/ (sum of spending on elementary and secondary education for current and capital expenditures). Student enrollment data come from NCES, Table 203.40, Enrollment in Public Elementary and Secondary Schools, by Level, Grade, and State or Jurisdiction: Fall 2015, Digest of Education Statistics, 2017, https://nces.ed.gov/programs/digest/d17/tables/dt17_203.40.asp.
13 Winthrop Rockefeller Foundation, “Goals for Arkansas,” http://www.wrfoundation.org/what-we-do/goals-for-arkansas/increase-educationalattainment/, accessed July 23, 2018.
14 ForwARd Arkansas, “The State of Education in Arkansas, 2015 Full Report,” https://forwardarkansas.org/wp-content/uploads/2016/01/ForwardFullReport1-26-15FA.pdf.
15 Dawn Tirado Simpson, “2014 Annual Report,” Arkansas Commission on Closing the Academic Achievement Gap, http://www.arkansased.gov/public/userfiles/Policy_and_Special_Projects/GAP_2014/2014_AnnualReport_ClosingTheGap.pdf.
16 “Closing the Gap 2020: A Master Plan for Arkansas Higher Education,” https://static.ark.org/eeuploads/adhe/Closing_the_Gap_2020.pdf.
17 University of Arkansas, “By the Numbers,” https://www.uark.edu/about/bythe-numbers.php, accessed July 23, 2018.
18 Ibid.
19 U.S. News and World Report, “Best High Schools in Arkansas,” https://www.usnews.com/education/best-high-schools/arkansas, accessed July 23, 2018.
20 Ibid.
21 NCES, Table 205.80, Private Elementary and Secondary Schools, Enrollment, Teachers, and High School Graduates, by State: Selected Years, 2005 through 2015, Digest of Education Statistics, 2016, https://nces.ed.gov/programs/digest/d16/tables/dt16_205.80.asp?current=yes; NCES, Table 203.20, Enrollment in Public Elementary and Secondary Schools, by Region, State, and Jurisdiction:
Selected Years, Fall 1990 through Fall 2026, Digest of Education Statistics, 2016, https://nces.ed.gov/programs/digest/d16/tables/dt16_203.20.asp?current=yes.
22 Rebecca David and Kevin Hesla, “Estimated Public Charter School Enrollment 2017–18,” National Alliance for Public Charter Schools, https://www.publiccharters.org/our-work/publications/estimated-public-charter-schoolenrollment-2017-18.
23 Laura Monteverdi, “Home Schooling Popularity Soaring in Arkansas,” KTHV Little Rock, February 27, 2017, https://www.thv11.com/article/news/local/home-schooling-popularity-soaring-in-arkansas/415443502.
24 State of Arkansas, Bureau of Legislative Research, “Foundation Funding and the Matrix,” Bureau Brief, June 2017, http://www.arkleg.state.ar.us/education/K12/AdequacyReports/2018/2017-06-20/05-HighlightsFoundationFundingB LR01.pdf; Arkansas Department of Education, Fiscal and Administrative Services Division, “Arkansas School Finance Manual: 2017–2018,” http://www.arkansased.gov/public/userfiles/Fiscal_and_Admin_Services/Publication%20and%20reports/Arkansas_School_Finance_Manual/Arkansas_School_Finance_Manual_FY18_.pdf.
There are 12 main chapters in the book, each detailing and explaining and important part of the Arkansas economy. They are Median Household Income; Fortune 500 Companies; Economic Freedom; Personal Income; Wages; Poverty; Migration; Education Attainment; Government Revenue and Spending; Total Nonfarm Payroll Employment; Gross Domestic Product; Unemployment and Labor Force Participation
These 12 chapters were written by expert authors, including: Jeremy Horpedahl, an ACRE scholar and assistant professor of economics at the University of Central Arkansas; Amy Fontinelle, author and editor of hundreds of public policy works; and Greg Kaza, Executive Director of the Arkansas Policy Foundation.
If you are interested in sharing your thoughts and questions about Arkansas’s economy, we would love to hear from you. You can email ACRE at acre@uca.edu, tweet Dr. Jeremy Horpedahl, at @jmhorp, or comment on ACRE’s Facebook page.
If you would like a printed copy for your own home or office, please email acre@uca.edu with the subject line Printed Citizen’s Guide, and include your name, your organization’s name, and your address.