News

Landmark Gives $50,000 to UCA College of Business Enhancement Fund

Landmark PLC, Certified Public Accountants has given $50,000 to the University of Central Arkansas College of Business Enhancement Fund.

The enhancement fund supports student programming, enhanced learning opportunities, as well as professional development opportunities for students, faculty, and staff in the College of Business.

“This gift from Landmark makes our college stronger in a number of important ways,” said Michael B. Hargis, dean of the UCA College of Business. “Our students will have greater access to learning opportunities outside the classroom as well as enhanced professional development opportunities for students. Learning inside the classroom will improve as well, as our faculty will have more funding to attend professional development opportunities and additional training to ensure our curriculum remains current and rigorous.”

Landmark is a full-service public accounting and business advisory firm with four offices throughout Arkansas in Little Rock, Rogers, Fort Smith and Russellville.

In addition to the gift to support the UCA College of Business Enhancement Fund, Landmark supports the Department of Accounting through the Blake Payne Memorial Endowed Scholarship, available to juniors and seniors majoring in accounting. The scholarship honors the memory of Payne, who was a UCA College of Business alumnus and worked at Landmark.

The UCA College of Business has more than 1,600 undergraduate and graduate students. It offers 14 baccalaureate degrees, two master’s, one graduate certificate and one technical certificate across four academic departments and houses the state’s only insurance and risk management program. The UCA College of Business is accredited by the Association to Advance Collegiate Schools of Business (AACSB). Visit uca.edu/business for more.

UCA College of Business Hires 2 Accounting Faculty

The University of Central Arkansas College of Business has hired two faculty members in its Department of Accounting.

Mengyu Ma, Ph.D., and Qifeng Wu, Ph.D., were both hired as assistant professors of accounting.

Ma was an instructor of accounting at Florida International University. Her research interests include financial reporting quality, information environment, equity markets, debt contracting and financial analysts. She earned a bachelor’s and master’s in accounting from the Max M. Fisher College of Business at Ohio State University and a doctorate in business administration from Florida International University.

Wu was previously an assistant instructor at the University of Texas at El Paso. He conducts research on financial reporting quality, corporate governance and auditing. He earned a bachelor’s in computer information systems from Idaho State University, his master’s in accounting from the University of Idaho and a doctorate in accounting from the University of Texas at El Paso.

The UCA College of Business has more than 1,600 undergraduate and graduate students. It offers 14 baccalaureate degrees, two master’s, one graduate certificate and one technical certificate across four academic departments and houses the state’s only insurance and risk management program. The UCA College of Business is accredited by the Association to Advance Collegiate Schools of Business.

Mark McMurtrey Wins SWDSI Outstanding Educator Award

MBA Director Mark McMurtrey, Ph.D.

Mark McMurtrey, Ph.D., professor of management information systems and Master of Business Administration program director, has been awarded the Southwest Decision Sciences Institute Outstanding Educator Award.

The SWDSI is a division of the Decision Sciences Institute, a professional organization made up of those interested in sharing research on the study of decision processes and the application of quantitative and behavioral methods to the problems of society. The Outstanding Educator Award is one of the most prestigious honors presented by the Federation of Business Disciplines and SWDSI.

“Knowing that my name will be forever linked with these other winners is absolutely humbling and quite an honor. I know my family is proud of me, and my late parents as well,” McMurtrey said.

McMurtrey has served as program chair for the SWDSI’s 2017 conference and served as the organization’s president from 2019-20. He is in his 19th year as professor at UCA and fifth year as MBA director.

Read more here.

Putting the GDP Numbers in Context: What You Need to Know

By Jeremy Horpedahl, Ph.D.

Jeremy Horpedahl, Ph.D.

We all know that we are going through one of the worst economic downturns in US history. But how bad exactly is the downturn? The recently released Gross Domestic Product data for the second quarter of 2020 paint a very grim picture, with the headline number suggesting that the economy contracted by -32.9%.

GDP is a measure of all economic activity that takes place in a quarter or a year. Was there really one-third less activity in the second quarter compared with the first quarter? No there was not. The actual number is about a 7% decline. I’ll explain more how I came up with that number, but let me stress this is still a very bad number. It’s the worst we have on record, possibly the worst in US history, probably even worse than any one quarter of the Great Depression (if we had directly comparable data). Still, a number like -32.9% is not a very helpful number in the current context.

Interpreting economic data is challenging during the current economic crisis. My intent is not to downplay the harm, but to give it proper context. For example, I have previously written that the unemployment rate understates how much pain there is in the labor market right now. In contrast, the recently released GDP data overstate the economic pain.

Read more at Texas CEO Magazine.

Horpedahl also recently appeared on The Cato Institute’s Daily Podcast to give a quick rundown of the numbers. Listen here or anywhere you get podcasts.

E-Payment Use and Perceptions in Japan

Japan is one of the world’s most advanced and largest economies, yet lags behind in its use of e-payment and e-commerce.

In 2018, the Bank of Japan found only 18% of its citizens used e-payment systems. A recent study by three UCA College of Business professors and two students found that age and gender play a significant role in e-payment usage in Japan. The results, recently published in the Global Journal of Business Disciplines, showed males were more likely to use e-payment systems, as well as older residents.

Previous research has found several factors played a role in Japan’s slow adoption of e-payment, including the fact many local retailers and stores do not use or accept e-payment systems. Only 17% of Japan retail sales are made up by e-payment systems, compared to 85% in South Korea, 56% in Singapore and 35% in India.

The postponed 2020 Olympic Games, to be held in Tokyo, provide a new incentive for a faster adoption as millions will visit the country next summer and expect to be able to use e-payments to purchase goods and services. In 2017, the Tokyo Metropolitan Government estimated the games would create nearly $284 billion in economic benefits.

Three UCA College of Business professors — Alex Chen, Ph.D., professor of management; Steve Zeltmann, Ph.D., professor of management information systems; and Ken Griffin, Ph.D., former associate dean of the College of Business — and two students — Moe Ota and Risa Ozeki — examined perceptions of benefits, trust, security, ease of use, quality and competency and how they impact the use of e-payment systems in Japan.

When asked how frequently they use e-payment, 21.6% of respondents said they did not. Less than 15% used it more than 3 times a week and the average weekly use was 1.5. Incentives were shown to be most closely associated with increased e-payment use.

“One of our major findings is the relationship between gender and e-payment behavior,” Chen said. “Men were more likely to use e-payment systems than women in Japan.”

The study found older people were more likely to use e-payment than younger people.

“It is reasonable to assume older people in this group are more likely to have a full-time job and, perhaps, a higher income,” Chen said. “Since they probably spend more money and have more money to manage, e-payment is a good platform for them to use.”

Chen said the upcoming Olympics would serve as the most important marketing tool and expects to see Japanese consumers will use e-payment systems more often in its aftermath.

“People from all over the world are expected in Japan and those people will expect the availability of e-payment,” he said. “The Japanese government and banking system understand this, and e-payment systems will be promoted as necessary to attract this business to Japanese vendors.”

Insurance & Risk Manager Director Featured on Insurance Town Podcast

Cynthia Burleson, director of the Center for Insurance & Risk Management in the UCA College of Business, was featured in June on an episode of the Insurance Town podcast.

Cindi Burleson, director of the Center for Insurance & Risk Management

The podcasts talks to personalities and leaders in the Arkansas insurance and risk management industry and is hosted by Heath Shearon. The duo discusses Burleson’s journey from the industry to the classroom, UCA’s involvement in insurance programs and events, the Arkansas Insurance Hall of Fame — housed in the UCA College of Business — and the insurance program’s noteworthy internship program.

The College of Business’ four-year insurance and risk management degree is the only of its kind in the state. The program was designated as a Global Center of Insurance Excellence last year.

Listen to the podcast here.

Hannah Robinson Receives Big I Arkansas Insurance Scholarship

Hannah Robinson, a senior Insurance & Risk Management student in the UCA College of Business, received the Independent Insurance Agents of Arkansas’ Sam Golden Memorial Scholarship on July 15.

The $1,000 scholarship honors the memory of Sam Golden who was a territory manager for Progressive Insurance and advocate of BIG I Arkansas. He also served on the Independent Insurance Agents of Arkansas Education Foundation, which awards the annual scholarship in his name.

Robinson, a White Hall native, is due to graduate in 2021. She currently interns at Union Standard Insurance Group in underwriting.

The Insurance & Risk Management program in UCA was established in 2000. It is the only four-year program of its kind in the state of Arkansas.

What’s the Real Unemployment Rate?

By Jeremy Horpedahl, Ph.D.

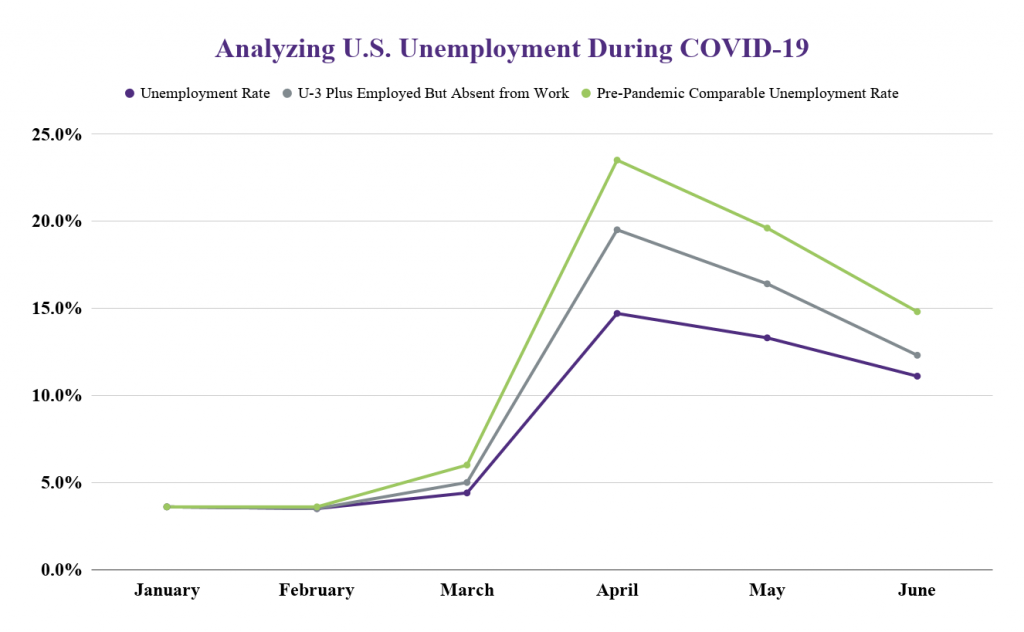
The latest data on the U.S. labor market was released on July 2 and saw the unemployment rate drop to 11.1% and nearly 5 million jobs were added in June. The unemployment rate aims to give a broad picture of how the labor market is performing. June’s rate is lower than 14.7% and 13.3% in April and May, respectively, but is still well above January and February when it was under 4%.

The unemployment rate has limitations in normal times, and during the current health and economic crisis it has even more limitations. To account for these limitations, it is useful to look at two broader measures of the number of people out of work. This allows us to see the percent of people out of work is higher than the official unemployment rate, but the trends are broadly the same: April was the worst month for the labor market, and there has been significant improvement in May and June.

What’s Wrong with the Unemployment Rate?

Jeremy Horpedahl, Ph.D.

There are two major problems with the official unemployment rate. First, is a current issue with the survey itself, which is administered by the Census Bureau. Survey takers were instructed to classify workers as unemployed (on temporary layoff) if they were not at their job due to COVID-19, but some survey takers classified these people as employed (but absent from work). BLS is aware of the problem and working to more accurately and consistently classify unemployed people correctly.

Thankfully, BLS also provides us with the data so we can reclassify these workers ourselves. That’s what the second, middle line does in the accompanying chart. Classifying all of those workers who aren’t at their job because of COVID-19, we see that these alternate unemployment rates are slightly higher: 12.3% vs. 11.1%. But the trend is the same as the official unemployment rate, and the classification problems are getting smaller over time (only about 1 million misclassified workers in June, compared with 7.5 million in April).

There is another, potentially bigger reason the unemployment rate undercounts the severity of the economic crisis: People who have dropped out of the labor force are not counted in the unemployment rate. If a worker has lost their job — not just on temporary layoff — and they are not currently looking for a new job, they don’t exist for purposes of calculating the official unemployment rate. And there are a lot of people in this situation: currently over 4.6 million people (though down from 8.1 million people in April).

As with the misclassified workers, BLS provides enough data that we can add these workers back in and count them as unemployed. Putting both of these groups of people into the unemployed category gives us the third highest line on the chart. This method was suggested by Michael D. Farren at the Mercatus Center, and he calls it the Pre-Pandemic Comparable Unemployment Rate. I have updated the data using his method in the accompanying chart. As we can see in the chart, this rate is higher still: 14.8% in June. But that’s a big improvement over April and May.

We don’t have similar data at the state level, so we can’t make similar adjustments to Arkansas’s unemployment rate. We do know that in May 2020, Arkansas’s unemployment rate of 9.5% was lower than the national average of 13.3%, and lower than Arkansas’s number from April, which was 10.8%.

What’s Next for the Labor Market?

Looking at the past few months of unemployment data is important for understanding how bad the pandemic has been for the U.S. labor market. But it doesn’t tell us what we really want to know: What happens next?

There is no guarantee that the unemployment rate and other alternate rates will continue to fall just because they have for two months. And I have no crystal ball to tell you what will happen next. The unemployment rate data is always a bit behind what we would like: the most recently released data was for the second week of June, and we won’t see data for the July reference week (which is July 12-18) until Aug. 7.

There are two possible scenarios for the next month in the US labor market. The first is that states continue to lift restrictions on business and personal activity, and that Americans become less concerned about the effects of COVID-19 on their own health and the health of others. People will then spend more money in the economy in general, but also more money specifically in industries that have been hit the hardest, such as leisure and hospitality. More workers will come back to their jobs, businesses will resume hiring, and the unemployment rate will continue to fall.

There is also a pessimistic scenario. The reopening of state economies appears to have led to an increase in positive COVID-19 cases in almost every state, and in a few states — such as Arkansas, Texas, and Arizona — these new cases have turned into more COVID-19 deaths. Most states have not seen a corresponding increase in deaths so far, but the next month will show whether that bad scenario will be true.

The increase in positive cases alone has caused some states to pause their reopening and a few have even gone backwards and shut down previously reopened industries, such as bars and restaurants. The increase in positive cases could also cause Americans to be more worried, and to continue to stay home and spend less money regardless of whether states impose new restrictions. Under that scenario, not only would the improvements in the labor market cease, they could go the other direction and July could see a higher unemployment rate.

What data can we look at in the meantime while we wait for the July unemployment report, which is still about a month away? One resource I recommend is the Opportunity Insights Economic Tracker, created by researchers at Harvard. This tool provides data on consumer spending, small business revenue, and several other useful resources that is continuously updated as new data becomes available.

The consumer spending data is currently updated through June 24. While it shows that consumer spending is still about 7% below its pre-pandemic levels, that’s a huge improvement from being down 30% in early April. This tool is also nice because it allows you to look at individual states. Arkansas has been back to pre-pandemic consumer spending levels for about a month, though we can also see that spending at restaurants in Arkansas is still down about 23%.

By watching the data on the Opportunity Insights tool as it comes out, we can get a better sense of where the labor market and the U.S. economy is heading. In addition to consumer spending in that tool, keep your eye on the three business indicators they track — small business revenue, small businesses open, and job postings — as well as the “time outside home” indicator to see how much people are moving around in the country and in individual states.

While these measures don’t tell us directly how many people are unemployed, they give us a sense where the economy is heading. There is also data available on the number of people filing unemployment insurance claims. It is difficult to directly translate this into how many people are unemployed, but it is worth tracking too. The Insured Unemployment Rate tells us what percent of the labor force is currently collecting unemployment insurance benefits, and it is updated weekly. The changes in this measure can give us some indication of where the labor market numbers are heading and what we might see in the next BLS monthly labor market report.

One final thing to keep in mind with unemployment insurance: As part of the CARES Act passed by Congress in March 2020, individuals who lose their job and are eligible for unemployment insurance have also been receiving an additional $600 per week on top of their normal state benefits. Unless Congress extends it, that additional $600 per week payment is set to end at the end of July.

While we don’t know if Congress will extend it, end it, or modify it in some way, we can make some predictions about what happens if the $600 per week payment does go away. One major possibility is that many workers would return to their jobs once the benefits expire. The expanded weekly benefits provide some incentive to stay home, which is part of the intuition behind providing it in this crisis, and without the payments some workers may be more willing to head back to work. But, if many businesses stay closed either due to government orders or a lack of consumer demand, those workers may have no jobs to return to, and they will now have much less money in their pockets to spend in the economy.

It’s hard to say which of these effects will dominate, but that’s another thing to watch for in the next few weeks as we move into August.

Jeremy Horpedahl is an assistant professor of economics at the UCA College of Business and research scholar at the Arkansas Center for Research in Economics.

How Are States Preparing for the Future?

The following is an excerpt from an article at RealClearPolicy by David T. Mitchell, Ph.D., director of the Arkansas Center for Research in Economics, and Dean Stansel, Ph.D., an economist at the O’Neil Center for Global Markets and Freedom at the Southern Methodist University’s Cox School of Business in Dallas.

COVID-19 is having an immense impact on state finances. Revenue collection is in free fall and spending is increasing as people make unemployment claims and switch from private insurance to Medicaid. And unlike the federal government, state governments do not have the option of rampantly running up their “credit cards” through budget deficits. They are required to balance their budgets.

That means tough choices are on the immediate horizon. In response, the National Governors’ Association (NGA) has called for $500 billion from the federal government. While NGA Vice Chair and New York Governor Andrew Cuomo’s state is in dire condition, not all states are doing so poorly.

One reason is that state policymakers long ago developed a tool to help deal with cyclical downturns in revenue. These budget stabilization funds are often referred to as “rainy day funds” (RDF’s) because they enable states to set aside money during good times to use when the next recession or other emergency hits.

Entering 2020, we were in a 10.5-year economic expansion, the longest one on record. Thus, we were due for a recession eventually. Many states managed their finances well during those expansionary years and built up sizable RDF balances rather than pursuing huge spending increases. Others did not.

We have been researching state fiscal crises for over a decade. Our findings indicate that states which increase spending faster during good times tend to end up paying for that extravagance later with worse fiscal crises during recessions.

To read the entire story, click here.

How Influence Transparency Affects Product Efficacy and Purchase Intentions

By Parker Woodroof, Ph.D.

Social media influencers are rapidly emerging as a popular marketing tool for brand managers, but consumers are increasingly exposed to marketing messages while simultaneously becoming more adept at tuning them out1.

Parker Woodroof, Ph.D., assistant professor of marketing

Marketers are motivated to develop communication strategies that consumers do not easily identify as a persuasive marketing attempt by the brand2. One strategy that is increasingly being used is influencer marketing, which allows brands to communicate to an interested audience through the voice of someone they ostensibly trust3.

The utilization of influencers, such as celebrities4&5, brand community members6, and bloggers7 for marketing efforts enhances consumers’ brand attitudes and increases purchasing. The ability to reach a sizeable portion of the target market quickly and cost-effectively makes influencer marketing an increasingly popular promotional tool8.

In 2019, 89% of marketers reported return on investment from influencer marketing is similar to, if not better than, other marketing channels and as of 2018, 65% of marketers said they planned to increase their influencer marketing budgets9. Influencer marketing growth is estimated to be $6.5 billion, with earned media value up to $18 per dollar invested10. By 2022, the industry is expected to be worth $15 billion9. Consumers have long held that celebrities are authentic customers who are motivated by a genuine predilection for the product or brand rather than financial gain11.

However, roughly 50% of social media users are not able to identify when promotional posts are sponsored12. Consumers are likely to be unduly influenced by influencer marketing campaigns they perceive to be genuine, non-commercial content.

This paper investigated how the type of endorsement disclosure used by a social media influencer impacts consumer perception of influencer transparency, product efficacy, and purchase intentions.

The Research

Participants viewed a mock Instagram post designed to look like it was created by a celebrity (Ryan Seacrest) and captioned with either a clear disclosure or a more ambiguous disclosure. The disclosure conditions were based on two variations of what the FTC deems acceptable regarding endorsement disclosure in social media contexts.

In the clear-disclosure condition, the post caption began with “#ad” (the caption read: “#ad I’ve been using @brightwhitesmile for a few months and I love it.”) In the ambiguous-disclosure condition, the brand is merely “thanked” for providing the product as a gift.

Participants were shown one of the pretested disclosure stimuli (i.e., a mock Instagram post in which a celebrity endorses Bright White Smile). Participants were randomly assigned to either the clear (#ad) or ambiguous (“thanks for the gift”) disclosure condition.

They were asked to “imagine you’re scrolling through your Instagram feed and see the following post recently made by [Influencer] on Instagram that was also shared on [his/her] Facebook, Twitter, and Snapchat accounts.”

Results

When consumers become cognizant that an influencer’s branded promotional post may have been motivated by an underlying financial relationship, they evaluate the influencer as significantly less transparent if a more ambiguous disclosure is used relative to a clearer disclosure. Transparency perceptions of the influencer impact consumers’ perceptions of product efficacy, as well as, purchase intentions.

Purchase Intentions

Transparency perceptions of social media influencers affect product-efficacy expectations, which are closely linked to purchase behavior13. The relationship between consumers and companies is influenced not only by transparent actions taken by the company but also by the consumer’s estimation of how the company is behaving when transparency cannot be observed14. Transparency is one of the basic conditions and values establishing positive relationships between customers and companies15. When consumers with activated persuasion knowledge — which suggests that consumers learn how to manage persuasive attempts and develop certain coping strategies that impact the effectiveness of marketing communication16 — are exposed to social media influencer posts with clear disclosures, their perceptions of both influencer transparency and product efficacy will be more positive, resulting in greater intention to purchase the product being promoted by the influencer.

Theoretical Implications

Consumers are less likely to detect ambiguous language indicative of paid sponsorship for the post unless persuasion knowledge is activated. Consumers need regulators, such as the FTC and ASA, to protect their vulnerabilities by requiring social media influencers to use disclosure language that is clear and prominent concerning their compensatory relationships with brands. Otherwise, consumers may not evaluate social media influencers who utilize ambiguous disclosures as less transparent and, in turn, these consumers may make purchases they might have otherwise avoided.

Consumers perceive influencers who are not forthcoming about commercial relationships with brands as promoters of inferior products, and consumers will be less inclined to purchase the products in the future. These findings imply that additional consumer education and strong public policy are needed to protect against unethical manipulations via predatory marketing tactics.

They need to believe an influencer is being transparent to have confidence that the promoted product is of high quality.

For an influencer’s brand to be valuable to companies, their brand must be credible. Ambiguous disclosures can lead an influencer to be evaluated as less transparent. Over time, this will likely cause the influencer to be seen as untrustworthy and/or less “genuine,” which directly conflicts with the attributes required for meaningful and successful connections between social media influencers and their audiences18.

Managerial Implications

Attempts to conceal the commercial relationship between the brand and influencer are effective, as evidenced by consumers evaluating social media influencers using ambiguous disclosures as being essentially equally transparent compared with social media influencers who use clear disclosures. The influencer “should make it obvious” when a relationship exists.

As consumers become more discerning in their consumption of social media content, brands risk damaging product perceptions by employing covert tactics. The lack of transparency negatively affects consumers’ perceptions of product efficacy and, ultimately, their purchase intentions. Additionally, influencers themselves are potentially damaging their own credibility by utilizing these covert tactics.

Clearly disclosing relations will benefit companies and influencers so that consumer perceptions of product efficacy and quality are not diminished. Previous research has shown that about 40% of people switch brands due to perceptions of poor efficacy19. Marketing managers should have clear guidelines and contracts for influencers detailing disclosure expectations.

The way in which content is prioritized into news feeds and subsequently shared on social media frequently changes and impacts consumers. For example, Facebook recently updated their algorithm to prioritize “meaningful user content” over public/commercial content. The update prioritizes posts that “spark conversations and meaningful interactions between people” instead of posts that receive the most views, clicks, and reactions20. This update has altered the content to which Facebook users are exposed and has contributed to a steep decline in engagement for many brands that rely on the platform for promotion21.

Because social media influencers’ posts may be favored by algorithms, product and brand managers may be more likely to turn to influencer marketing as a means of more directly reaching consumers with branded messages. It becomes increasingly important to understand the nuances involved in crafting effective product- and brand-related posts to be distributed by influencers. This includes determining the best methods for disclosing the commercial relationships underlying the social media influencer promotional posts.

The results of the studies in this research prescribe the use of clear disclosure over vague nods at brand-influencer relationships as the best long-term strategy. This confirms previous research indicating that covert marketing undermines the building of relationships with consumers22.

Current research suggests that individuals are inherently trusting of social media content, consuming content through a social lens rather than a consumer lens. Although clear disclosures such as #ad and more ambiguous “thank you” language-type disclosures are both technically FTC-compliant, it appears consumers do not understand that “thanking a brand for a gift” is an indication of an underlying relationship between the brand and the influencer unless their persuasion knowledge is activated.

From a regulatory perspective, the findings of the present research substantiate the need for the FTC to modify its guidelines to disallow the use of “thank you” language as an acceptable form of sponsorship disclosure. FTC guidelines for social media influencers are constantly evolving. For example, from the conceptualization of this research to publication, the FTC guidelines for social media influencers changed multiple times.

Managers should be aware that these guidelines change regularly as the FTC evolves in its understanding of how to protect consumers against unfair social media influencer practices. Many letters have been written by the FTC to social media influencers recently shunning unethical behavior. Social media influencers merely altering a post retroactively once they have been caught will likely not be adequate in the future as consumers’ persuasion knowledge, skepticism and scrutiny of social media influencer posts continue to increase. Regulatory agencies differ from country to country. Managers should be diligent in keeping abreast of regulations regarding disclosures used in influencer posts.

Social media platforms (e.g., Facebook, YouTube, Instagram, and Twitter) and regulatory agencies (e.g., FTC, CMA or ASA) should prioritize consumer education of appropriate social media influencer behavior. These organizations have to recognize that they have a responsibility to cultivate and mature consumers’ persuasion knowledge so that consumers, social media influencers and brands have equitable and sustainable relationships. Failure to actively strengthen consumers’ persuasion knowledge undoubtedly demonstrates complicity by these organizations.

“What’s Done in the Dark Will be Brought to Light: Effects of Influencer Transparency on Product Efficacy and Purchase Intentions” was published in the Journal of Product & Brand Management. The research was completed by Parker Woodroof, Ph.D., assistant professor of marketing in the UCA College of Business; Katharine M. Howie, Ph.D., assistant professor at the University of Lethbridge’s Dhillon School of Business; Holly Syrdal, Ph.D., assistant professor of marketing at Texas State University; and Rebecca VanMeter, Ph.D., assistant professor of marketing at Ball State University.

  1. Campbell, M.C., Mohr, G.S., and Verlegh, P.W. (2013), “Can disclosures lead consumers to resist covert persuasion? The important roles of disclosure timing and type of response”, Journal of Consumer Psychology, Vol. 23 No. 4, pp. 483-95.
  2. Wei, M. L., Fischer, E., and Main, K. J. (2008), “An examination of the effects of activating persuasion knowledge on consumer response to brands engaging in covert marketing”, Journal of Public Policy & Marketing, Vol. 27 No. 1, pp. 34-44.
  3. Newman, D. (2015), “Love it or hate it: Influencer marketing works,” available at: https://www.forbes.com/sites/danielnewman/2015/06/23/love-it-or-hate-it-influencermarketing-works/#ff3e949150b3, (accessed November 5, 2018)
  4. Djafarova, E. and Rushworth, C. (2017), “Exploring the credibility of online celebrities’ Instagram profiles in influencing the purchase decisions of young female users”, Computers in Human Behavior, Vol. 68, pp. 1-7.
  5. Jin, S.A.A. and Phua, J. (2014), “Following celebrities’ tweets about brands: The impact of twitter-based electronic word-of-mouth on consumers’ source credibility perception, buying intention, and social identification with celebrities”, Journal of Advertising, Vol. 43 No. 2, pp. 181-95
  6. Kim, E., Sung, Y. and Kang, H. (2014), “Brand followers’ retweeting behavior on Twitter: How brand relationships influence brand electronic word-of-mouth”, Computers in Human Behavior, Vol. 37, pp 18-25.
  7. Lee, J.E. and Watkins, B. (2016), “YouTube vloggers’ influence on consumer luxury brand perceptions and intentions”, Journal of Business Research, Vol. 69 No. 12, pp. 5753-60.
  8. Phua, J., Jin, S.V., and Kim, J.J. (2017), “Gratifications of using Facebook, Twitter, Instagram, or Snapchat to follow brands: The moderating effect of social comparison, trust, tie strength, and network homophily on brand identification, brand engagement, brand commitment, and membership intention”, Telematics and Informatics, Vol. 34 No. 1, pp 412-24.
  9. Mediakix (2019), “INFLUENCER MARKETING 2019 INDUSTRY BENCHMARKS”, available at: https://mediakix.com/influencer-marketing-resources/influencer-marketingindustry-statistics-survey-benchmarks/, (accessed August 29, 2019).
  10. Influencer Marketing Hub (2019), “The State of Influencer Marketing 2019: Benchmark Report”, available at: https://influencermarketinghub.com/influencer-marketing-2019- benchmark-report/, (accessed August 29, 2019).
  11. Atkin, C. and Block, M. (1983), “Effectiveness of celebrity endorsers”, Journal of Advertising Research, Vol. 23 No. 1, pp. 57-61.
  12. Sterling, Greg (2017), “Survey: Most consumers unaware that paid influencer posts are #ads”, available at: https://marketingland.com/survey-consumers-unaware-paid-influencerposts-ads-227021, (accessed August 29, 2018).
  13. Kramer, T., Irmak, C., Block, L.G., and Ilyuk, V. (2012), “The effect of a no-pain, no-gain lay theory on product efficacy perceptions”, Marketing Letters, Vol. 23 No. 3, pp. 517-29.
  14. Kitchin, T. (2003), “Corporate social responsibility: A brand explanation”, Journal of Brand Management, Vol. 10 No. 4, pp. 312-26.
  15. Reynolds, M. and Yuthas, K. (2008), “Moral discourse and corporate social responsibility Reporting”, Journal of Business Ethics, Vol. 78 No. 2, pp. 47-64.
  16. Friestad, M. and Wright, P. (1994), “The persuasion knowledge model: How people cope with persuasion attempts,” Journal of Consumer Research, Vol. 21 No. 1, pp. 1-31.
  17. Hsieh, Yi-Ching, Hung-Chang Chiu and Mei-Yi Chang (2005), “Maintaining a Committed Online Customer: A Study Across Search-Experience-Credence Products,” Journal of Retailing, Vol. 81 No. 1, pp. 75-82.
  18. Kowalczyk, C.M. and Pounders, K.R. (2016), “Transforming celebrities through social media: the role of authenticity and emotional attachment”, Journal of Product & Brand Management, Vol. 25 No. 4, pp. 345-56.
  19. Rees, D. (2006), “Feelings outweigh facts”, Pharmaceutical Executive, Vol. 26 No. 2, pp. S28– S33.
  20. Mosseri, A. (2018), “Bringing People Closer Together”, available at: https://newsroom.fb.com/news/2018/01/news-feed-fyi-bringing-people-closer-together, (accessed October 13, 2018).
  21. Erskine, R. (2018), “Facebook engagement sharply drops 50% over last 18 months”, available at: https://www.forbes.com/sites/ryanerskine/2018/08/13/study-facebook-engagementsharply-drops-50-over-last-18-months/#16ca74c794e8 (accessed October 15, 2018).
  22. Milne, G.R., Rohm, A., and Bahl, S. (2009), “If it’s legal, is it acceptable?”, Journal of Advertising, Vol. 38 No. 4, pp. 107-22.